

I made mistakes in my field experiment.
Some I caught early.
Some I only understood when I was deep in the data months later.
All of them trace back to decisions made before a single measurement was taken.
I ran an open-air field experiment measuring how warming and elevated ozone affected tree growth and soil carbon across dozens of experimental plots over a full growing season. That experience, combined with postgraduate training in designing ecological and environmental experiments, gave me a very practical understanding of what good experimental design actually looks like in the field versus what it looks like in a textbook.
This article walks through how to design a field experiment properly, what the key decisions are, and where things tend to go wrong in practice.
What Is a Field Experiment?
A field experiment is a study conducted in a natural or semi-natural setting where the researcher deliberately manipulates at least one variable and measures the effect on one or more outcomes, while keeping everything else as consistent as possible.
This is what separates a field experiment from field observation. Observation records what is already happening. Experimentation changes something and measures what happens as a result.
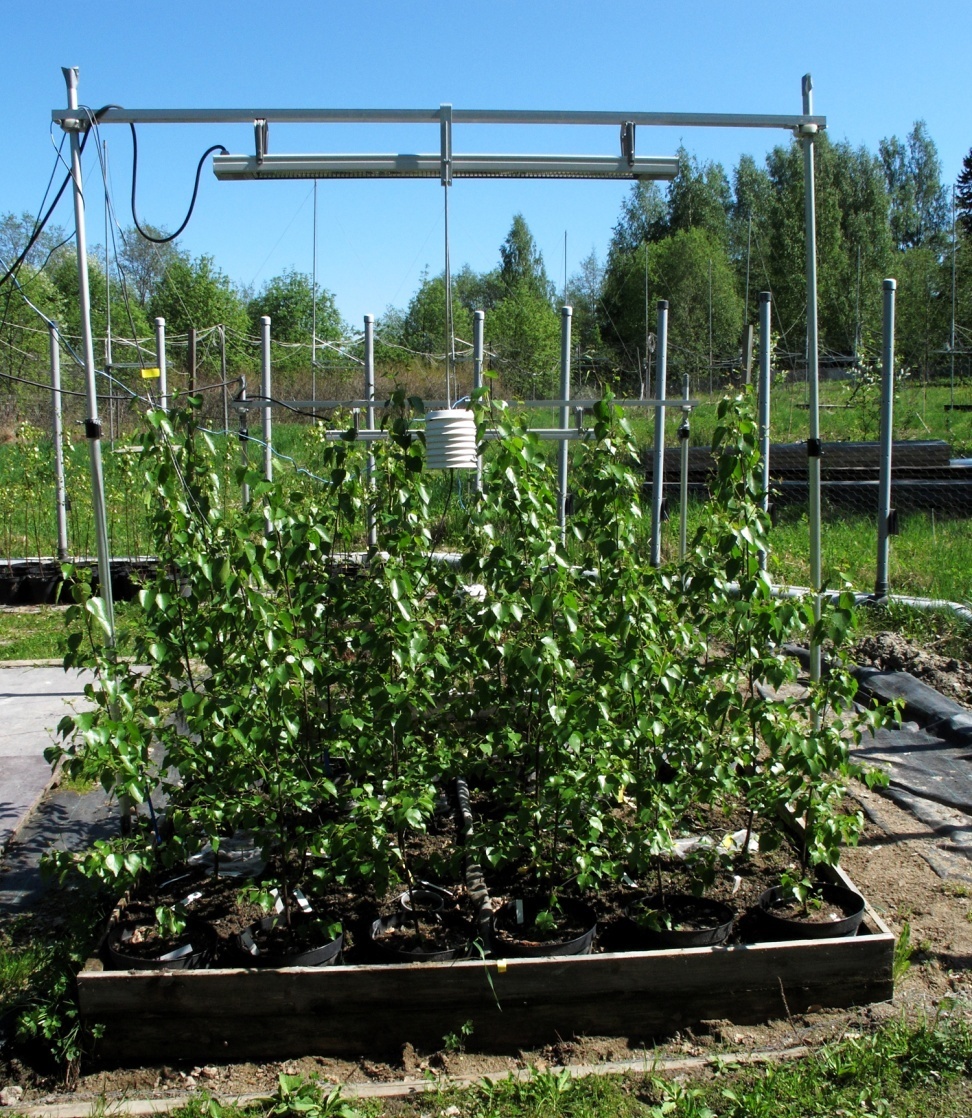
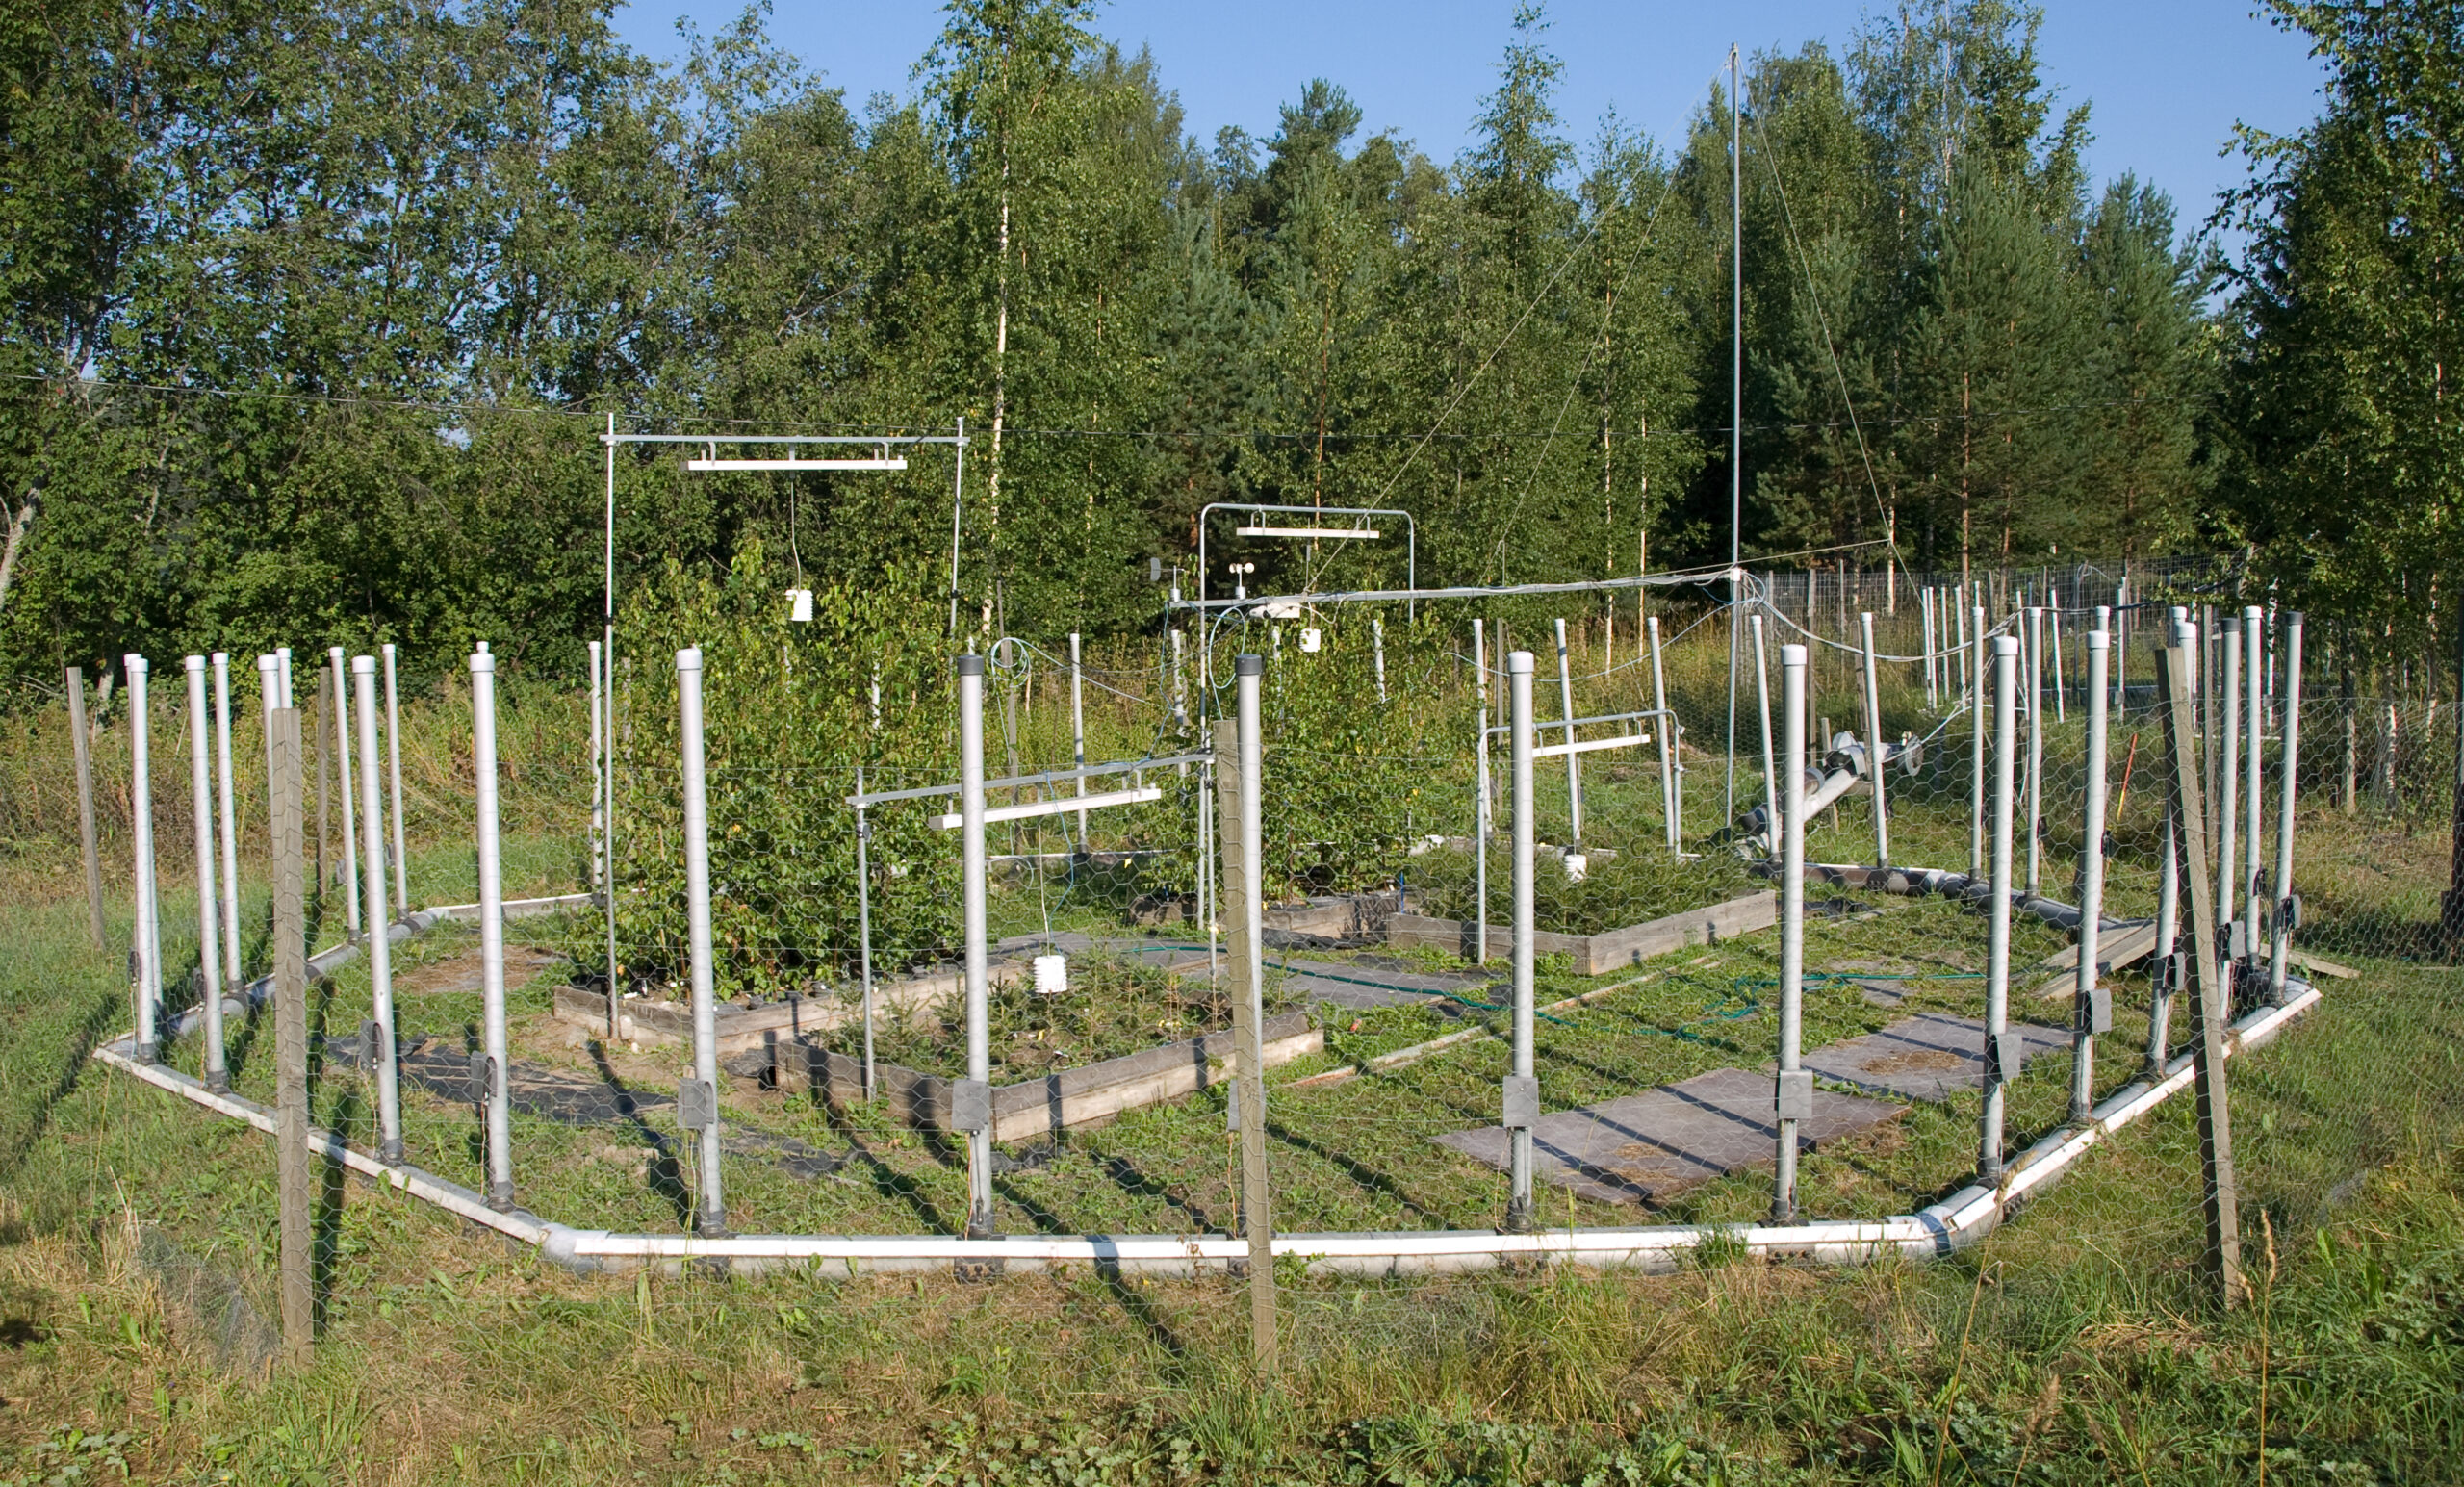
In my experiment, the manipulated variables were air temperature, raised using infrared heaters, and ozone concentration, elevated using a free-air fumigation system. The outcomes I measured included stem height, stem diameter, leaf area, leaf count, and soil CO₂ efflux. Everything else, soil type, plant species, watering regime, and plot size, was kept as consistent as possible across all plots.
Step 1: Start With a Clear Hypothesis
Every field experiment starts with a question. But a question is not a hypothesis.
“Does warming affect tree growth?” is a question. “Moderate warming will increase stem height growth by stimulating carbon assimilation during the growing season” is a hypothesis. It is specific, directional, and falsifiable.
A good hypothesis does three things. It names the variable you are manipulating. It predicts the direction of the effect. And it implies a mechanism, even briefly. Without a clear hypothesis you end up collecting data without knowing what you are actually looking for.
This was the first principle I took seriously from my postgraduate experimental design training. Start with the biology, not the method. Know what you expect to find and why, before you decide how to measure it.
Step 2: Choose Your Experimental Design
The most common designs in environmental field experiments are completely randomised, randomised complete block, and split-plot designs.
A completely randomised design assigns treatments randomly across all plots with no spatial grouping. Simple but vulnerable to spatial variation in the field. Soil gradients, drainage patterns, and light availability can all introduce noise into your results.
A randomised complete block design groups plots into blocks that share similar environmental conditions, then applies all treatments within each block. This is what I used. My experiment had eight circular plots arranged to account for spatial variation in the site. Within each plot, subplots received different treatment combinations, which controlled for plot-level differences in soil and microclimate.
A split-plot design is used when one factor is harder to manipulate at small scales than another. In my experiment, ozone fumigation operated at the whole-plot level while temperature treatments were applied at the subplot level. This hierarchical structure required specific statistical handling to avoid pseudoreplication.
Choosing the right design before you go to the field saves enormous headaches in the analysis phase. A design flaw you discover after six months of data collection cannot be fixed retroactively.
Step 3: Replication Is Non-Negotiable
Replication means having multiple independent units receiving each treatment. Without it you cannot separate the effect of your treatment from random variation between plots.
How many replicates do you need? The honest answer is more than you think, and the statistical answer comes from a power analysis, which estimates the sample size needed to detect an effect of a given size with acceptable confidence.
In my experiment, each treatment combination was replicated four times. That was the minimum for detecting moderate treatment effects with the statistical approach I used, a linear mixed-model ANOVA. With fewer replicates, real effects can disappear into noise.
A common mistake in student field projects is treating a single plot per treatment as sufficient because the field site is limited in size. One plot per treatment is not a replicated experiment. It is a demonstration. The distinction matters enormously when you try to make any statistical claim about your results.
Step 4: Define Your Measurements Before You Start
Every variable you plan to analyse needs a measurement protocol written before you collect a single data point.
This means deciding exactly what you will measure, how you will measure it, how often, at what time of day, and who will do it. Consistency across measurement dates and across plots is what makes comparisons valid.
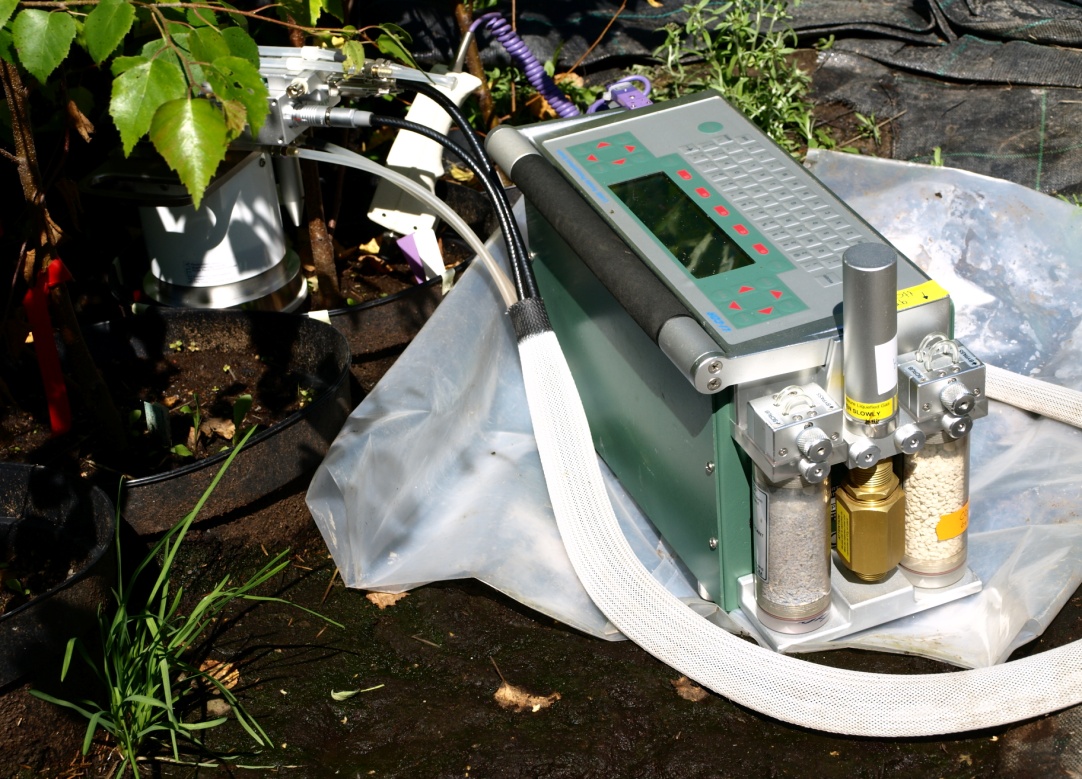
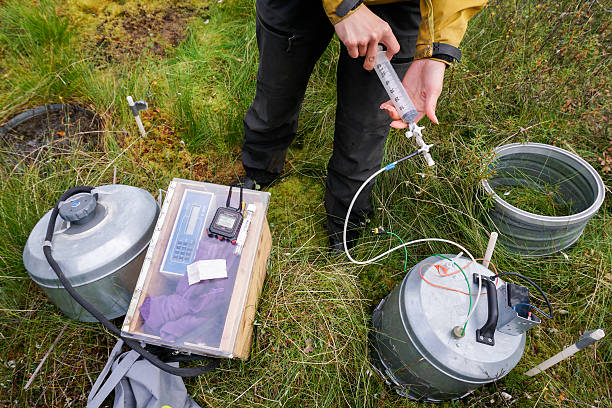
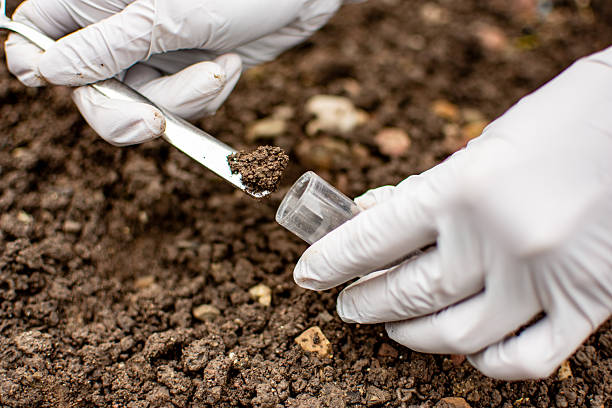
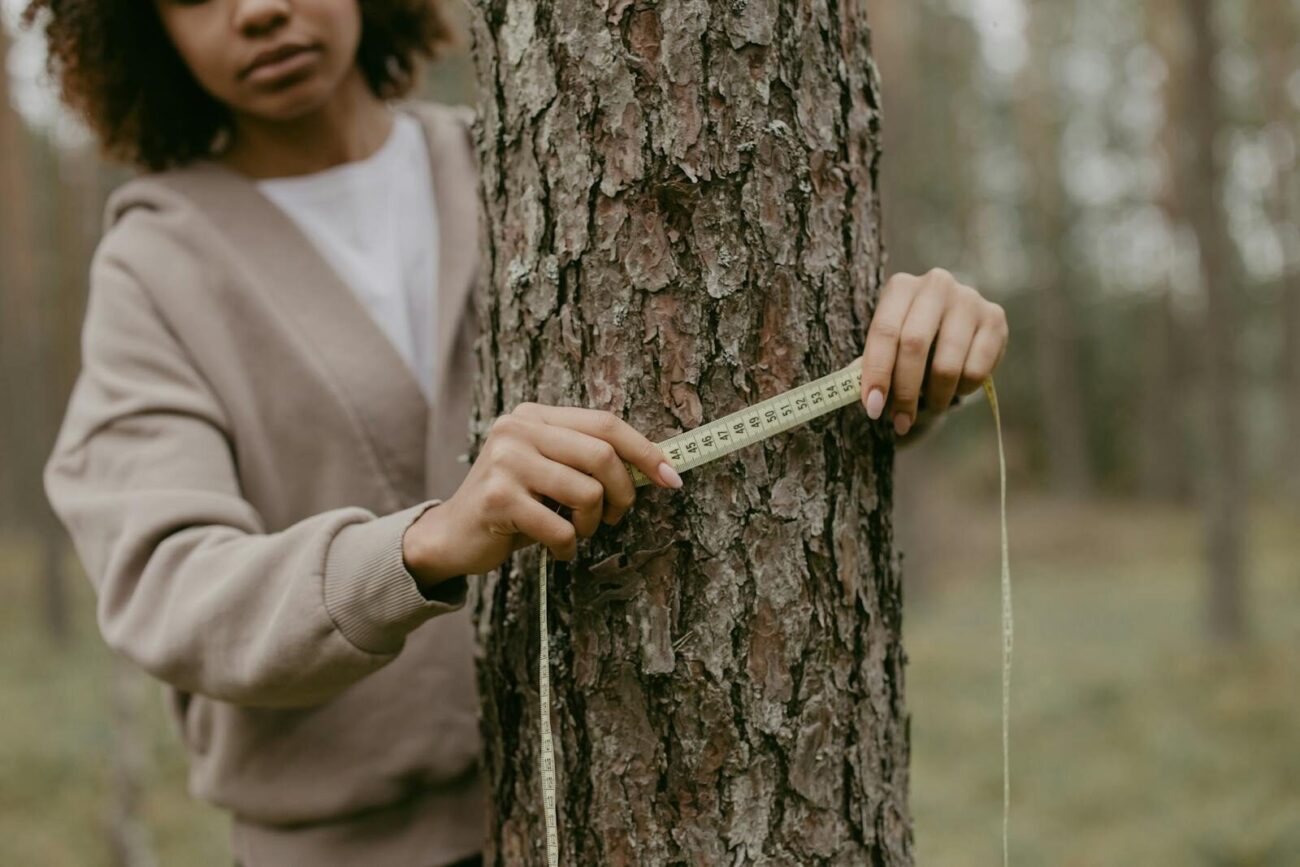
In my experiment, stem height and diameter were measured every three weeks from June to late August using the same marked measurement points on each tree. Leaf measurements followed a fixed protocol on the same marked branches throughout the season. Soil respiration was measured monthly at the same time of day to avoid confounding diurnal variation with treatment effects.
The datasheet structure matters too. Before going into the field each measurement day, the sheet had columns for date, plot, subplot, tree ID, genotype, treatment, and each measurement variable. Having that structure forced consistency and made data entry straightforward afterwards.
Step 5: Controls Are the Baseline Everything Else Is Compared Against
A control treatment receives no manipulation. It is the baseline against which you measure the effect of everything else.
In my experiment, control subplots received ambient air temperature and ambient ozone concentration. Every treatment effect I reported was calculated relative to these control values. Without a well-maintained control you cannot know whether what you observed in treated plots was caused by your treatment or by something else that changed over the season.
Controls need the same infrastructure, the same measurement frequency, and the same level of attention as treated plots. A common error is neglecting controls once the exciting treated plots are running. A poorly maintained control is almost as bad as no control at all.
Step 6: Account for Confounding Variables
A confounding variable is something that changes alongside your treatment and could explain your results instead of, or in addition to, the treatment itself.
In a warming experiment, the infrared heaters that raise air temperature also reduce soil moisture slightly by increasing evaporation. If I had measured only temperature and CO₂ efflux, I could not have separated the direct temperature effect on microbial activity from an indirect moisture effect. That is why I measured soil moisture and soil temperature simultaneously alongside every respiration measurement.
Identifying potential confounders before the experiment starts, then building measurement protocols that capture them, is one of the most important things a well-designed field experiment does.
Step 7: Plan Your Statistical Analysis Before Collecting Data
This sounds backwards to many students. Why think about analysis before you have any data?
Because the analysis you can do is determined entirely by the design you chose. A split-plot design requires a specific statistical approach. A randomised block design requires another. If you collect data without thinking about how you will analyse it, you may find that the test you want to run does not fit the design you ran.
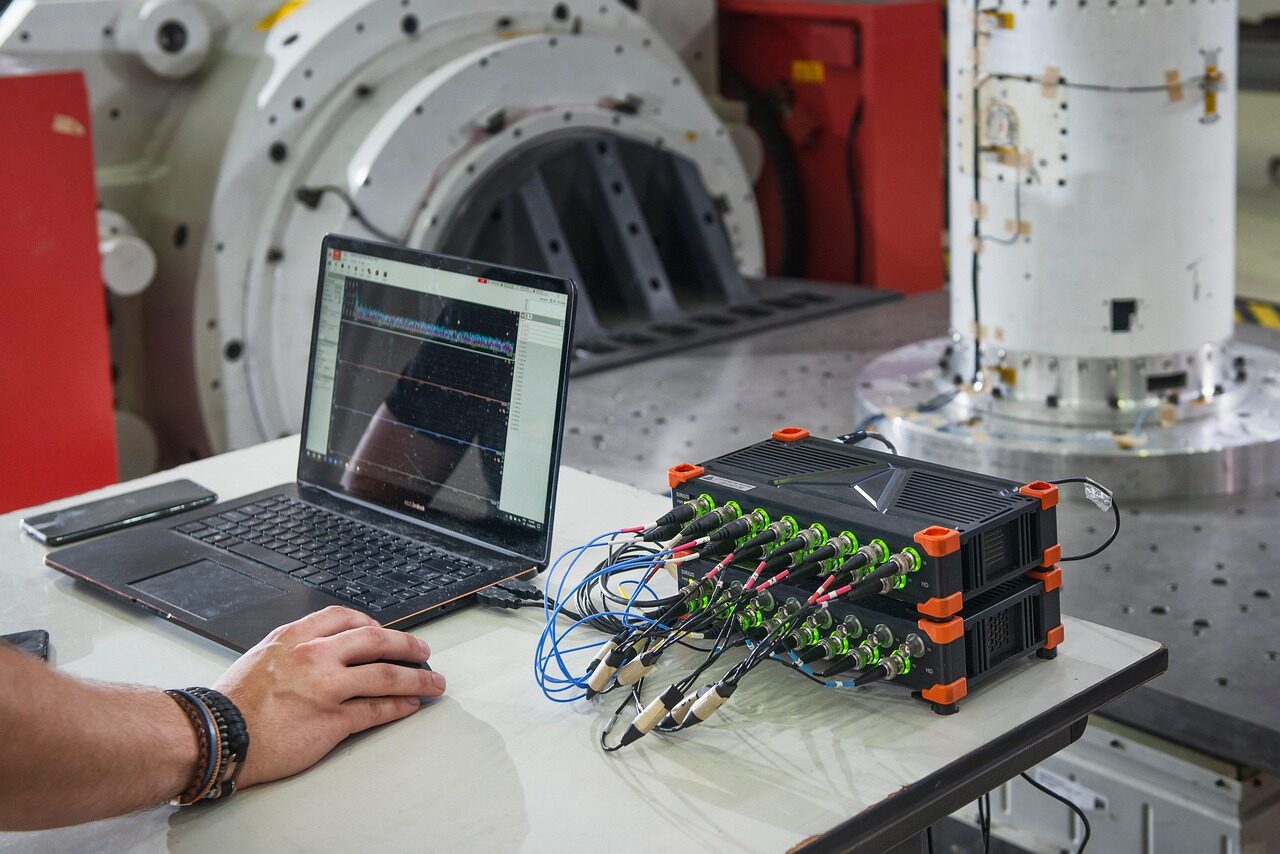
In my experiment, I used a linear mixed-model ANOVA with temperature, ozone, genotype, and measurement date as fixed factors and plot identity as a random factor. That statistical structure was decided during the design phase, not after data collection. It directly reflected the hierarchical structure of the experimental design with plots nested within treatment combinations.
What I Would Do Differently
Looking back at my own experiment with the benefit of having run it and analysed it, a few things stand out.
I would install all collars for soil respiration measurements at least a week before the first measurement date rather than 24 to 48 hours before. Root disturbance from collar insertion creates a temporary CO₂ pulse that takes longer to settle than the standard guidance suggests, particularly in active growing season soil.
I would build in more measurement dates early in the season when growth rates are fastest and treatment effects are most dynamic. Monthly soil respiration measurements captured the overall pattern but missed some of the early-season variation that would have strengthened the temporal analysis.
And I would design a more systematic approach to photographing each plot at each measurement date. The qualitative visual record of how plots changed through the season turned out to be genuinely useful context for interpreting the quantitative data, and I wished I had been more systematic about it from the start.
Frequently Asked Questions
What is a field experimental design?
It is the plan for how you will manipulate variables, assign treatments to plots, replicate observations, and collect measurements in a natural or semi-natural setting. The design determines what statistical analysis you can do and what conclusions you can draw from your results.
What are the steps of experimental design in environmental science?
Start with a clear hypothesis, choose an appropriate design such as randomised block or split-plot, determine your replication needs, define measurement protocols before data collection, establish proper controls, identify potential confounders, and plan your statistical analysis before going to the field.
What is an example of a field experiment in environmental science?
An open-air warming experiment where infrared heaters raise air temperature in some plots while others serve as unheated controls, with measurements of plant growth, soil respiration, and gas fluxes taken repeatedly throughout the growing season. This is the type of experiment I ran, measuring how modest warming and elevated ozone affected tree growth and soil carbon cycling.
What are the four types of experimental design?
The main types used in environmental science are completely randomised design, randomised complete block design, split-plot design, and factorial design. Each suits different research questions and field conditions. The choice depends on how many factors you are manipulating, how much spatial variation exists in your site, and what statistical analysis you plan to use.
What makes research in environmental science particularly difficult?
Environmental systems are inherently variable and difficult to control. Weather, soil heterogeneity, seasonal changes, and species interactions all introduce noise that laboratory experiments do not face. Replication, careful plot design, and simultaneous measurement of confounding variables are the main tools for managing this complexity.
Why is replication so important in field experiments?
Without multiple independent plots per treatment you cannot separate the effect of your treatment from random variation between plots. A single treated plot and a single control plot is a demonstration, not an experiment. Statistical inference requires replication.
How long should a field experiment run?
Long enough to capture the full range of variation relevant to your question. A single growing season captures seasonal dynamics but misses interannual variation. My experiment ran for one growing season, which was sufficient for the growth and respiration questions I was addressing but would not have captured potential long-term ozone accumulation effects.