

Every forest researcher reaches a point where they need to measure leaf area. The question is not whether to do it, it is which method will give you accurate results without consuming your entire field season.
But you do not need to be running a large-scale forest experiment to find this useful.
Whether you are a student measuring a handful of potted plants in a lab, a curious mind who wants to track how your houseplants respond to different light conditions, or a researcher setting up a small controlled experiment, the same core methods apply. The difference between a field campaign with hundreds of trees and a kitchen table with three plant pots is scale, not principle.
I learned the practical side of this in my own research, measuring tree growth responses to environmental stress across multiple treatments throughout a full growing season. I used a ruler in the field, an Excel formula at the desk, and a flatbed scanner in the lab. Each method had a role. Comparing the results between them taught me more about measurement accuracy than any textbook had.
In this article I walk you through the main tools and methods for measuring leaf area, from simple field techniques to dedicated software, so you can pick the right approach for your situation.
Why Does Leaf Area Measurement Matter?
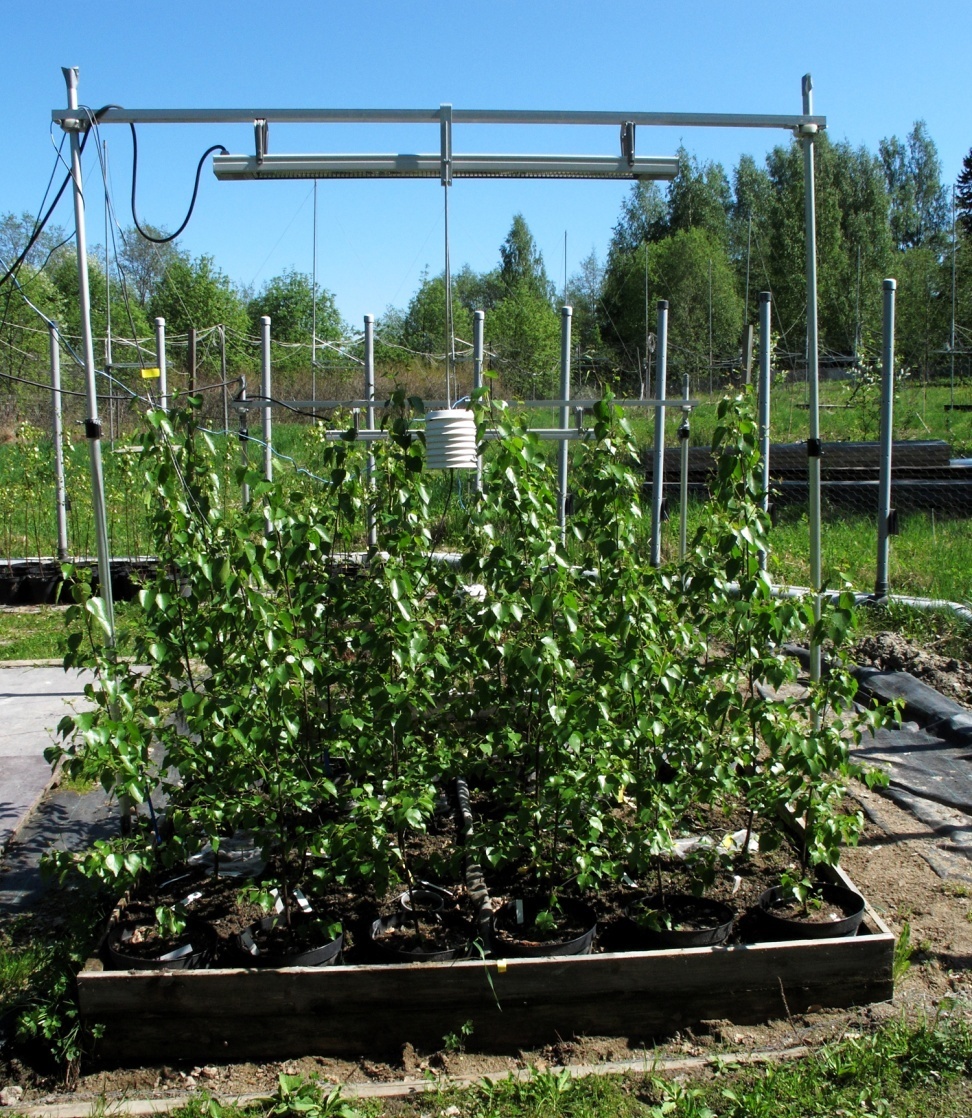
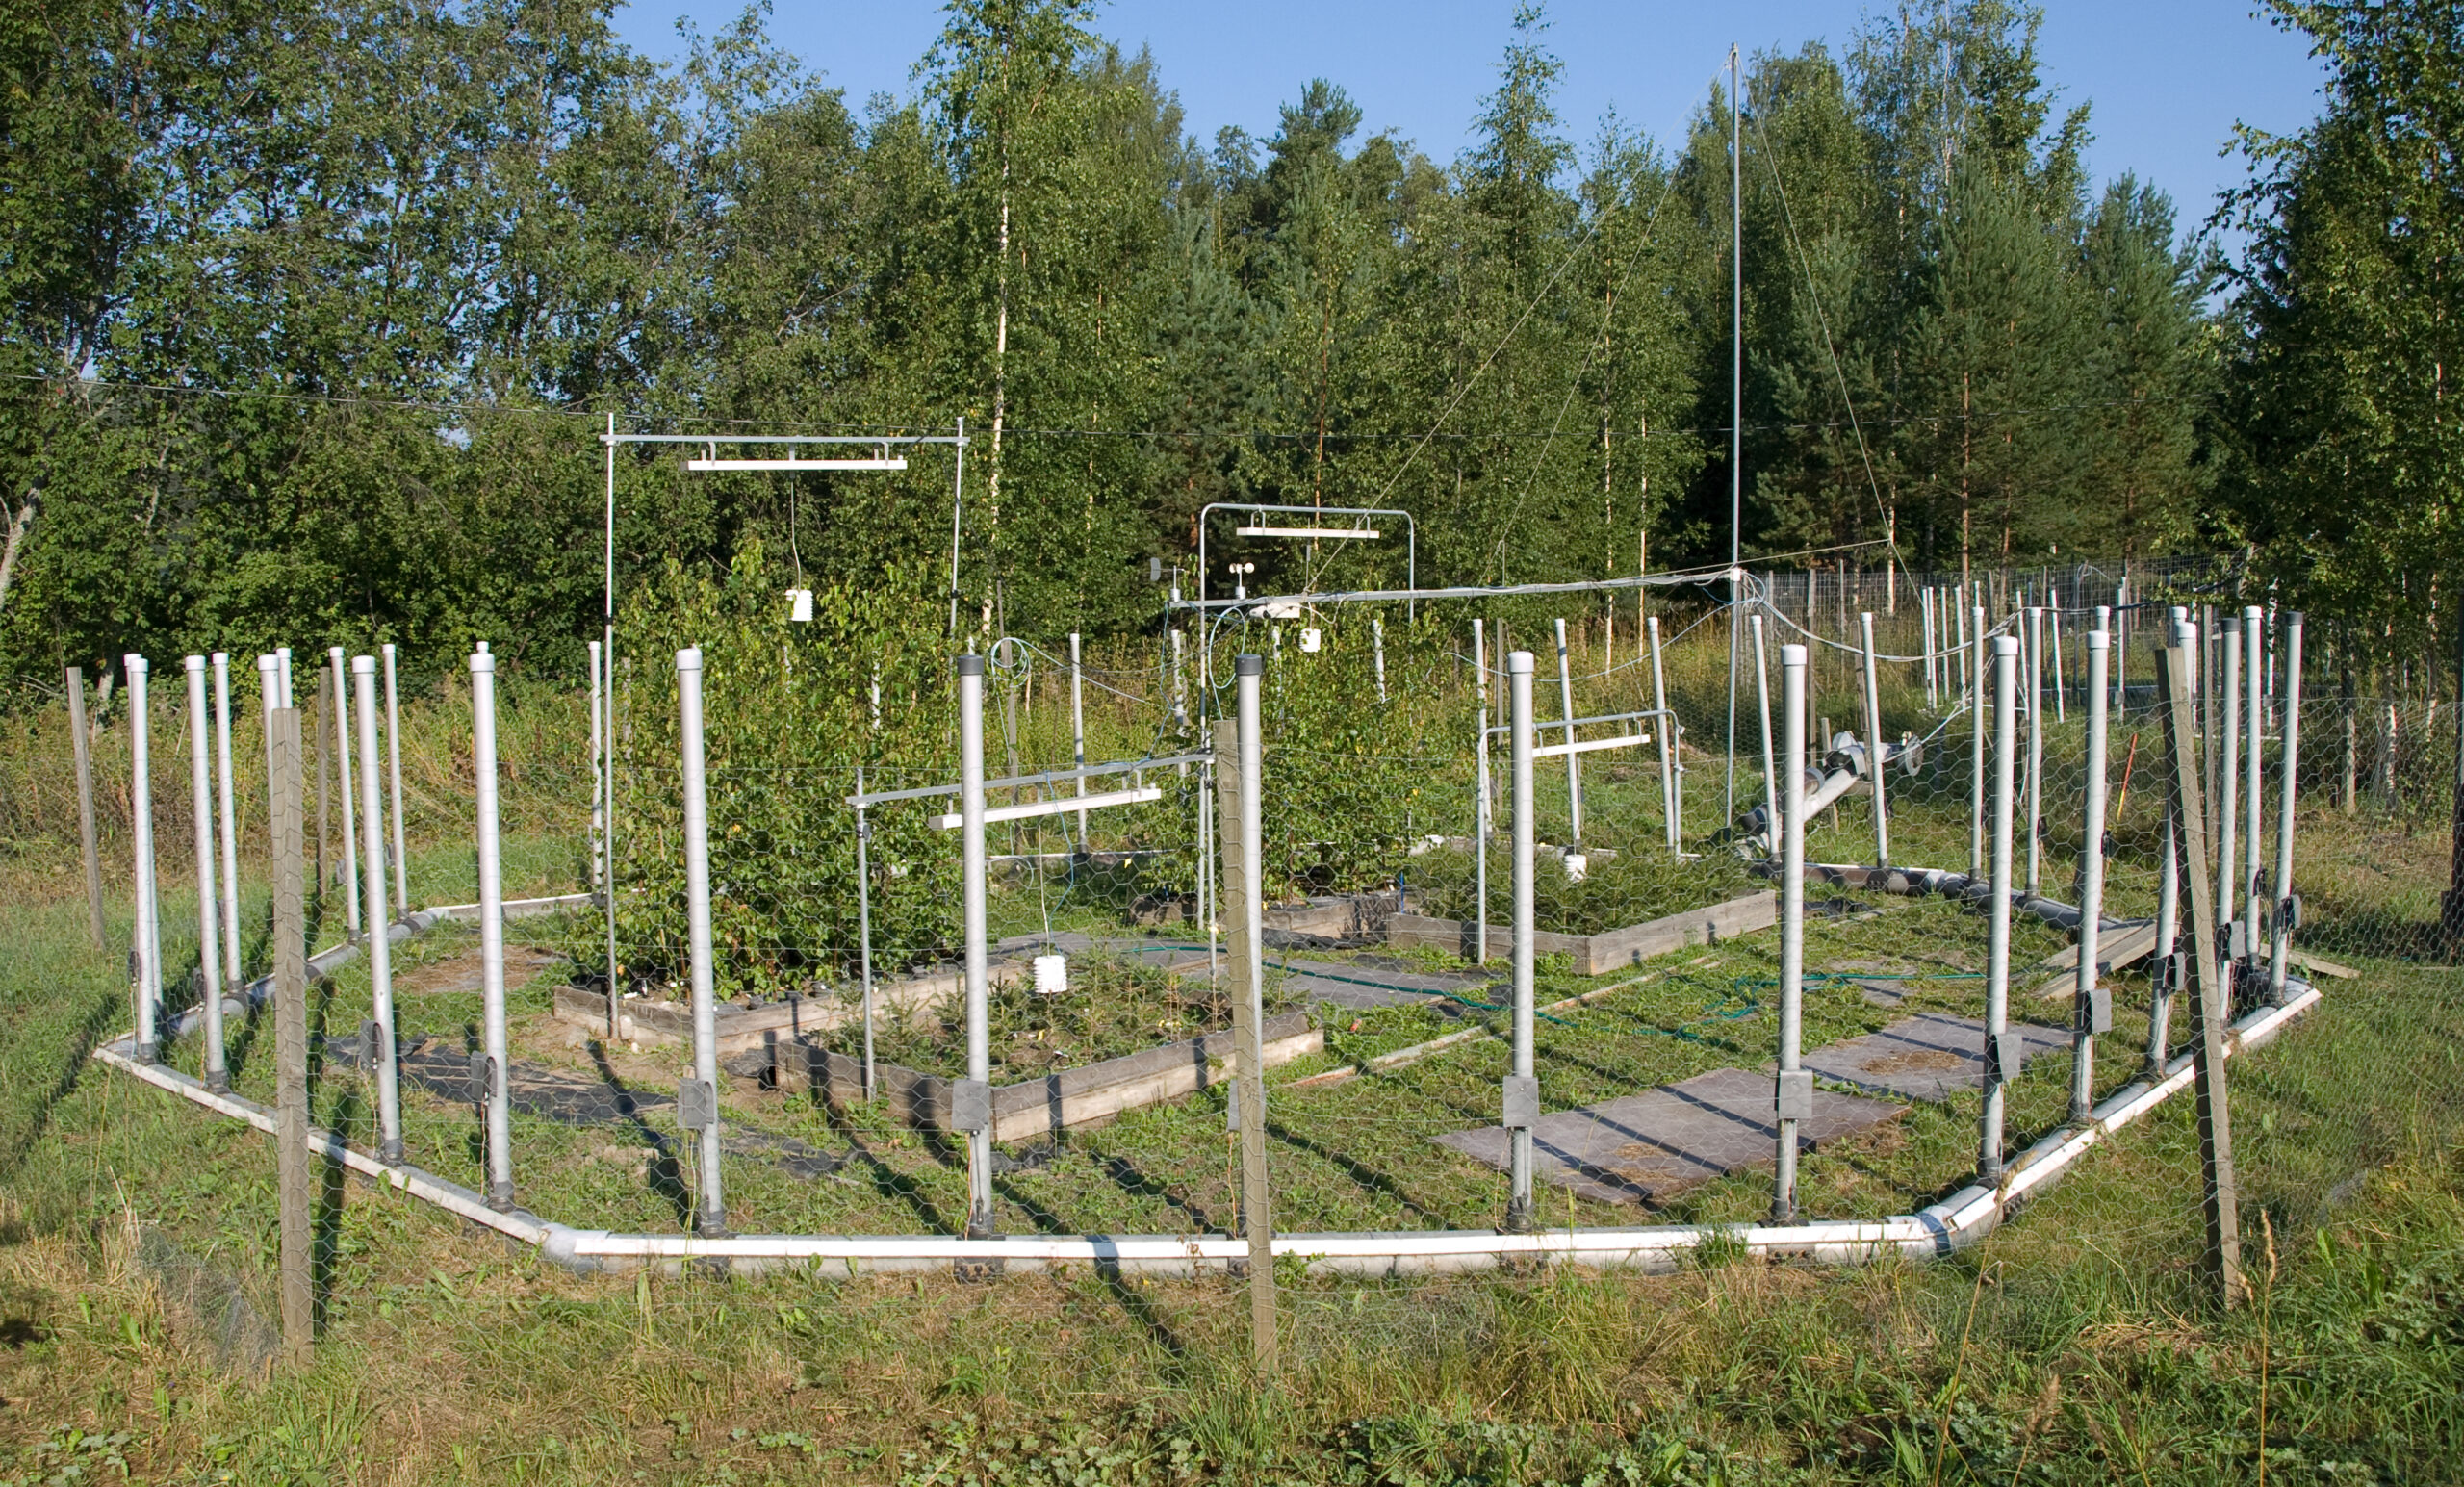
Leaf area is one of the most important parameters in plant and forest science. It directly reflects a plant’s capacity for photosynthesis, transpiration, and carbon assimilation. Tracking how leaf area changes under different conditions, whether that is warming, ozone stress, drought, nutrient levels, or simply different light exposure, tells you a great deal about how a plant is actually responding.
This is relevant at every scale. A researcher running a climate change experiment needs leaf area to quantify treatment effects. A student doing a lab project on plant growth under different fertiliser levels can use it to get a meaningful, comparable number. A gardener curious about why one side of their plant looks different from the other can use a simple ruler method to check whether leaf size is actually changing. Leaf area scales from a single houseplant on a windowsill to a forest canopy, and the core measurement principles are the same at every level.
In more formal research contexts, leaf area feeds into biomass estimation, canopy light interception modelling, water use calculations, and carbon allocation studies.
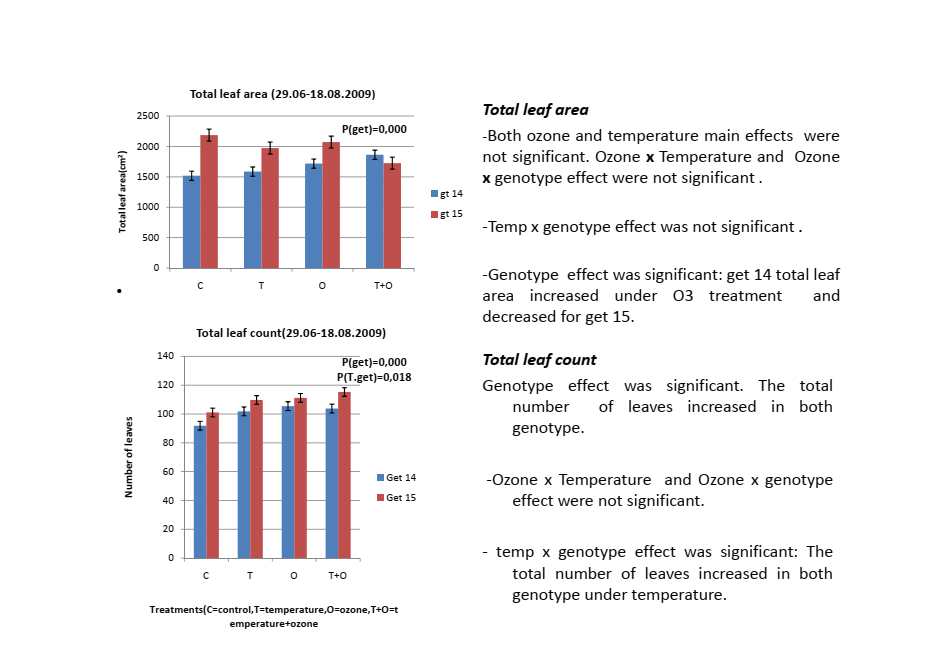
In my own field research, it turned out to be one of the most revealing parameters I measured. The same temperature treatment produced completely opposite responses in two genotypes of the same tree species. Without accurate leaf area data that difference would have been invisible. Getting the method right matters whether you are measuring three plants or three hundred.
Method 1: Ruler and Datasheet in the Field
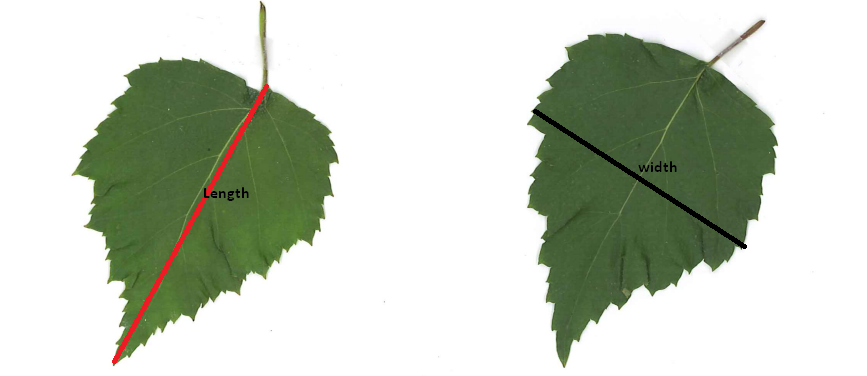
The most basic approach is measuring each leaf’s length and width with a ruler and recording the values on a paper datasheet. It sounds old-fashioned but it works, and it is still widely used in field ecology and forest research where portability matters more than automation.
In my field research, datasheets were structured with columns for date, tree ID, genotype, treatment, branch, and individual leaf measurements. Measurements were taken at roughly three week intervals throughout the growing season, giving a time series of leaf growth across treatments.
The calculation from length and width is straightforward. Leaf area approximates to length multiplied by width multiplied by a species-specific correction factor that accounts for the fact that leaves are not rectangles. This correction factor varies by species and leaf shape, typically between 0.6 and 0.75 for most broadleaved trees.
In practice I entered all field measurements into an Excel file that my supervisor had set up in advance with the leaf area formula already integrated. The columns were structured for date, tree ID, genotype, treatment, and individual leaf length and width. Once I typed in the length and width values from my datasheets, the leaf area column calculated automatically. Adding new rows just meant dragging the formula down. No manual calculation, no separate step.
This is a simple but genuinely useful setup that any researcher or student can replicate. If you are running a small experiment with a few plants, you can build the same thing yourself in Excel or Google Sheets in a few minutes. The formula is simply: leaf area = length × width × correction factor, where the correction factor is a fixed number specific to your species.
One practical detail I learned quickly: standing or kneeling to measure low branches for hours is not sustainable. I used a small chair in the field to sit at the right height for each tree. It sounds minor but it kept measurements consistent and saved a lot of time over a full season.
The limitations of this method are real. It introduces human error, particularly for irregularly shaped leaves or very small leaves where precise ruler placement is difficult. The correction factor assumes a consistent leaf shape across treatments and time, which may not always hold. And the Excel-calculated leaf area is an estimate, not a direct measurement. That is why validating against scanned leaf samples, which I cover in Method 2, is important for any research where measurement accuracy is critical.
Method 2: Leaf Scanning and Image Analysis in the Lab
To correct and validate my field ruler measurements, leaf samples were collected during morning hours and brought to the laboratory on the same day. Timing matters here. Leaves were placed in labeled paper envelopes immediately after cutting and kept out of direct sunlight to prevent excessive moisture loss before analysis. Scissors were used to cut each leaf close to the stem, keeping the petiole out of the measurement area.
Fresh and dry weights were measured from each sample. For dry weight, leaves were oven-dried at around 60°C for three days. For leaf area, we used Adobe Photoshop 7. The process involved scanning each fresh leaf, then using the marquee tool to make a selection around the leaf area with the petiole excluded. After applying a threshold to finalise the selection, we read the pixel count from the histogram in the palettes toolbar. That pixel count, combined with a known scale reference, gave us the leaf area in cm².
The scanned leaf area values were then plotted against the corresponding ruler measurements in a linear regression, done separately for each birch genotype. The resulting equations were used to correct the entire field dataset. The equations explained between 73% and 97% of the variance depending on genotype, which gave us reasonable confidence in the corrected field data.
This combined approach, ruler measurements in the field corrected by scanned reference samples in the lab, is a practical compromise many researchers use when continuous lab-based measurement is not feasible. The key is collecting enough reference leaves for a robust regression, handling samples carefully from the moment of collection, and processing them on the same day to avoid tissue degradation affecting the measurements.
Today researchers doing the same work have access to dedicated image analysis tools that make the scanning step considerably faster and more accurate than working through a general-purpose photo editor step by step.
Method 3: ImageJ
ImageJ is a free open-source image analysis programme developed by the National Institutes of Health. It is now one of the most widely used tools in plant science for leaf area measurement from scanned or photographed images.
You place leaves on a flatbed scanner with a scale reference, scan at a consistent resolution, then open the image in ImageJ. After setting the scale and applying a threshold to separate leaf pixels from background, ImageJ calculates the area automatically. With a batch processing setup you can analyse large numbers of scanned leaves efficiently.
ImageJ is free and runs on Windows, Mac, and Linux. You can download it directly from the NIH ImageJ page. For researchers already generating scanned leaf images it is almost always the first tool to consider. Its main limitation is that it requires some setup and familiarity before it becomes fast. For very large leaf numbers, the manual steps in the workflow still add up.
Method 4: WinFOLIA
WinFOLIA is a dedicated commercial leaf analysis software developed specifically for measuring leaf area, length, width, perimeter, and shape parameters from scanned images. It is more automated than ImageJ for high-throughput scanning work and includes features for analysing multiple leaves per scan simultaneously, separating overlapping leaves, and measuring leaf damage or necrotic areas.
For research programmes processing large numbers of leaf samples routinely, WinFOLIA offers a significant time saving over manual ImageJ workflows. The trade-off is cost. It is a commercial product and the licence fee puts it out of reach for some research budgets. It is particularly popular in forest ecology and ecophysiology research where leaf morphology is a primary study variable and sample volumes are high.
Method 5: Easy Leaf Area
Easy Leaf Area is a free software tool that uses colour segmentation to distinguish leaves from background in photographs taken with a standard camera or smartphone, using a red calibration square of known area as the scale reference.
The advantage over flatbed scanning is portability. You do not need a scanner. You can photograph leaves in the field immediately after collection and process the images later. For field campaigns where getting samples back to a lab scanner quickly is impractical, this flexibility is genuinely useful.
The limitation is accuracy. Colour segmentation from camera images is less precise than flatbed scanning, particularly for leaves with complex colours, surface texture, or variable light. For studies where high measurement precision is critical, flatbed scanning with ImageJ or WinFOLIA remains the more reliable choice.
Method 6: LeafByte
LeafByte is a free smartphone app for iOS that measures leaf area and leaf damage directly from photos taken with a phone camera. It uses a transparency sheet with a grid as a calibration reference placed under or over the leaf during photography.
For rapid field measurements where carrying a scanner is not possible and sample numbers are moderate, LeafByte offers a genuinely convenient option. It is particularly useful for measuring herbivory damage alongside total leaf area, since the app can distinguish consumed leaf area from intact leaf area. Its accuracy is comparable to Easy Leaf Area, which means it suits exploratory or monitoring work but requires validation against scanned measurements if high precision is needed.
Choosing the Right Method
The right method depends on your research context. Here is how I think about it based on my own experience.
If you are working in remote field conditions with no lab access and need rapid measurements across many plants, start with ruler measurements using a species-specific correction factor and collect reference samples for lab validation if you can.
If you have lab access and moderate sample numbers, flatbed scanning with ImageJ gives you the best combination of accuracy, cost, and flexibility. It is free, well-documented, and widely used enough that your methods will be directly comparable with published literature.
If you are processing very high sample volumes routinely and have budget for commercial software, WinFOLIA will save you significant time.
If portability and speed matter more than maximum precision, Easy Leaf Area or LeafByte are practical options for field-based or rapid-assessment work.
Whatever method you choose, always validate your measurements against a subset of known-area standards, derive species-specific or genotype-specific correction factors where relevant, and document your protocol clearly enough that another researcher could reproduce your work. In my experience, the consistency and documentation of your method matters as much as the method itself.
Frequently Asked Questions
What is the most accurate method for measuring leaf area?
Flatbed scanning combined with ImageJ or WinFOLIA gives the highest accuracy. Consistent scan resolution, a proper scale reference, and clean leaf-background separation are what determine quality.
Can I measure leaf area without a scanner?
Yes. Ruler measurements with a correction factor work well in field or home conditions. Easy Leaf Area and LeafByte use smartphone photos instead of scans, with some trade-off in precision.
What correction factor should I use for ruler measurements?
It depends on your species and leaf shape. The most reliable approach is to measure a reference subset with both ruler and scanner, then derive your own regression equation. In my field research I used separate equations for each tree genotype, which significantly improved accuracy.
Is ImageJ free?
Yes, completely free and open-source. Download it from the NIH website. It runs on Windows, Mac, and Linux.
What is specific leaf area and how is it different from leaf area?
Leaf area is the two-dimensional surface area of a leaf in cm². Specific leaf area (SLA) is leaf area divided by leaf dry mass in cm²/g. SLA tells you whether a plant is producing thin cheap leaves optimised for fast growth or thick durable leaves built for stress tolerance, making it useful in plant physiology, stress response studies, and carbon allocation research.
How many leaves do I need to measure for a reliable estimate?
For a small lab or home experiment, 10 to 15 leaves per treatment is usually enough to see a clear pattern. For formal research with treatment comparisons, 20 to 30 leaves per treatment is a more standard minimum.