

A field experiment without a data logger is just a series of snapshots. What happens between your manual measurements, overnight, during a storm, at 3am when nobody is there, is often exactly where the most important story is.
I learned this running an open-air field experiment where environmental conditions had to be monitored continuously throughout an entire growing season. Air temperature, soil temperature, soil moisture, relative humidity, wind speed, and wind direction were all recorded automatically around the clock. All of these fed into a central monitoring computer housed in a small cabin at the field site.
From there I could see real-time readings across all plots at once, check that equipment was operating correctly, and spot any anomalies without walking out to each plot individually. Without that continuous record and that live overview, interpreting my manual measurements of tree growth and soil respiration would have been far less reliable. The data logger system was not just a convenience. It was what made the experiment scientifically valid.
This article explains how data loggers work, what types are available, and what I would look for when choosing one for environmental field research.
What Is a Data Logger?
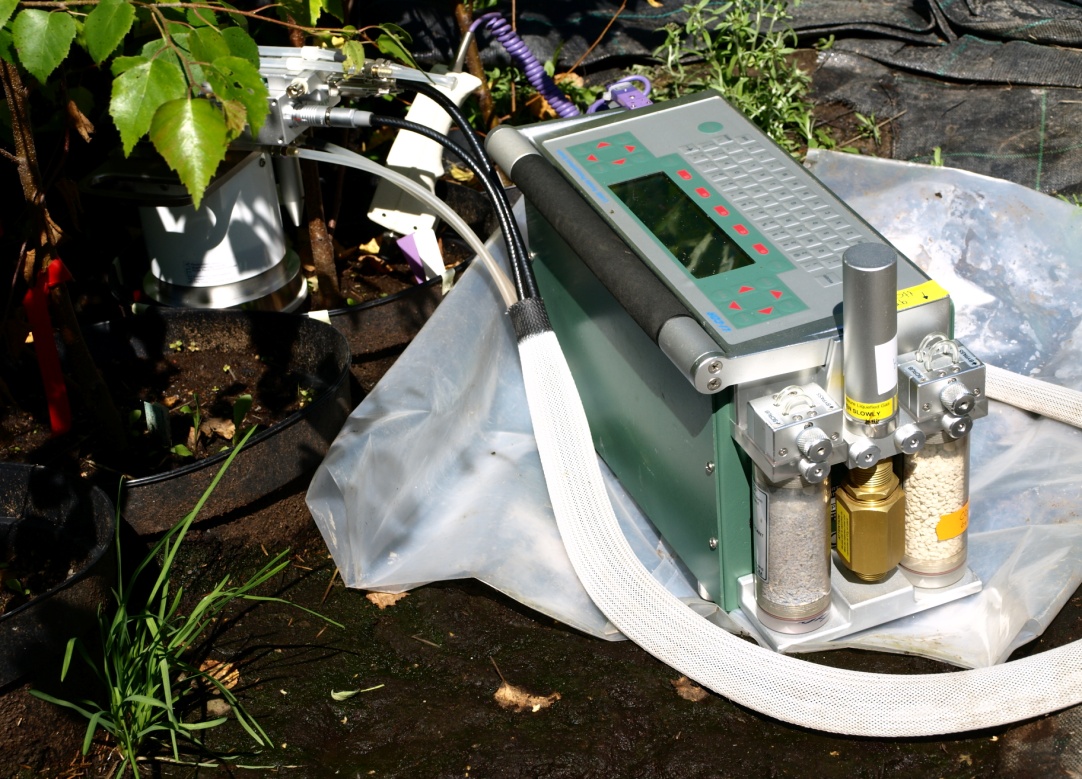
A data logger is an electronic device that automatically records measurements from connected sensors at defined time intervals and stores them for later retrieval or real-time transmission.
The core components are a microprocessor that runs the logging programme, an analogue-to-digital converter that translates sensor signals into readable values, onboard memory that stores the recorded data, a clock that timestamps every reading, and a power supply, usually batteries or solar panels for remote field deployment.
Sensors connect to the logger through input channels. Depending on the model, a single logger can handle anywhere from two to dozens of sensors simultaneously, recording temperature, humidity, CO₂ concentration, soil moisture, wind speed, rainfall, light intensity, and many other variables at the same time.
The result is a continuous timestamped dataset that captures how environmental conditions change over minutes, hours, days, and seasons, without anyone needing to be present.
Why Data Loggers Matter in Field Research
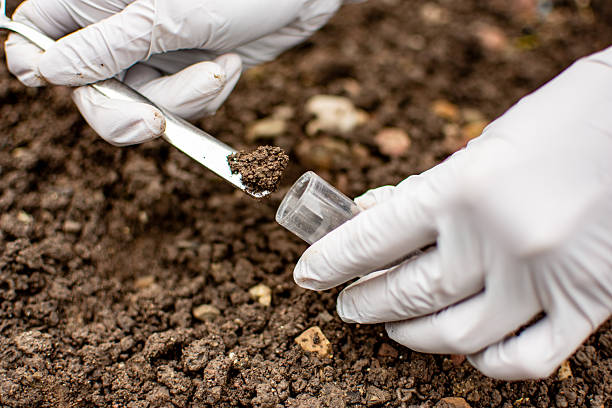
Manual measurements are essential for specific parameters like stem diameter or leaf area, where you need direct physical contact with the plant. But environmental background conditions, the variables that give context to everything else you measure, cannot be captured manually with any reliability.
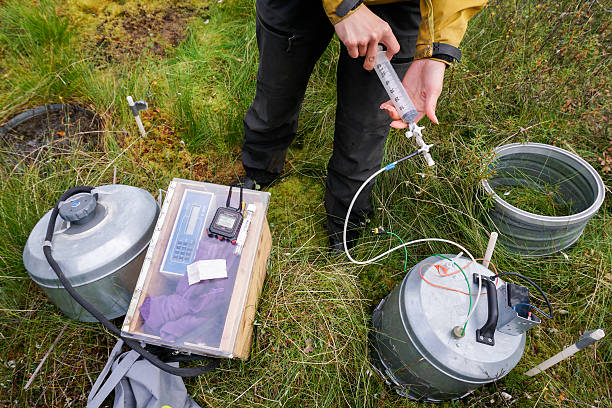
In my field experiment, I measured soil respiration monthly. But to understand whether a high reading on a particular date was driven by temperature, moisture, or the treatment effect I was studying, I needed to know exactly what those background conditions were at that moment and in the days leading up to it. The continuous data logger record made that interpretation possible.
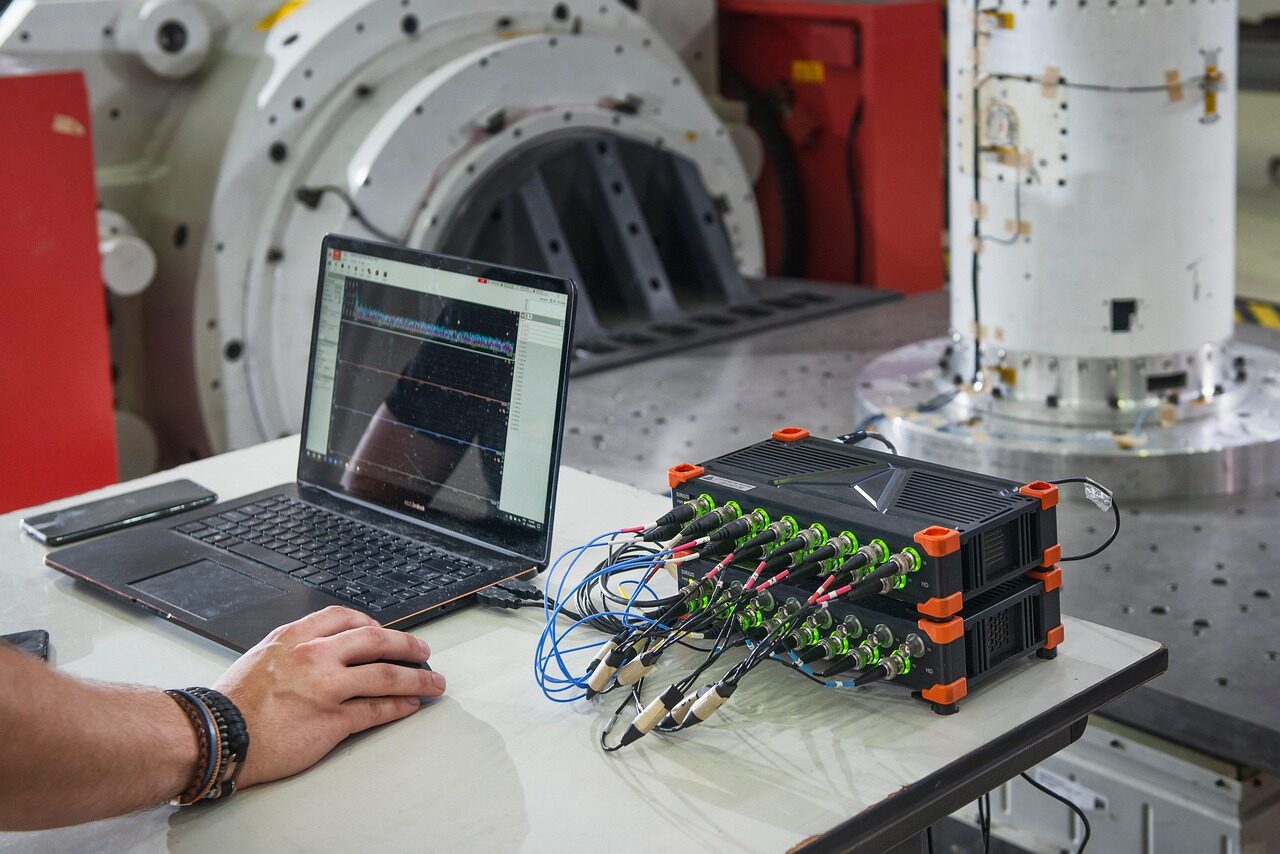
What made this particularly effective in my setup was the central monitoring computer in the field cabin. All the key environmental variables, soil moisture, air humidity, ozone concentration, and heating levels, fed continuously into that system. I could pull up a screen and see real-time readings across all plots simultaneously.
I could verify that the ozone fumigation system was maintaining the right concentration. I could check that the infrared heaters were holding the target temperature differential. And I could catch a sensor failure or unexpected reading immediately rather than discovering it weeks later when downloading data. That kind of live oversight changes how you manage a field experiment.
This is something I feel strongly about from direct experience. A single data point without environmental context is difficult to interpret. A data point with a complete surrounding environmental record becomes genuinely meaningful. My postgraduate training in data quality control for environmental measurements reinforced this point consistently.
Continuous background monitoring is not optional in a well-designed field experiment. It is the foundation everything else rests on.
Types of Data Loggers Used in Environmental Research
Entry-level standalone loggers are self-contained units that record data to internal memory for manual download at regular site visits. These are the most accessible option for students, small projects, and budget-constrained research. They typically measure one to four parameters, run on standard batteries for months, and connect to a laptop via USB for data download.
For anyone starting out with environmental monitoring, I think this is the right place to begin. They are affordable, simple, and reliable enough for most short to medium-term projects.
Research-grade multi-channel loggers offer greater flexibility, more input channels, and higher measurement precision. They are compatible with a wide range of sensors and can measure meteorological, hydrological, and soil conditions simultaneously. These are the standard choice for long-term monitoring stations, eddy covariance towers, and complex multi-sensor field experiments.
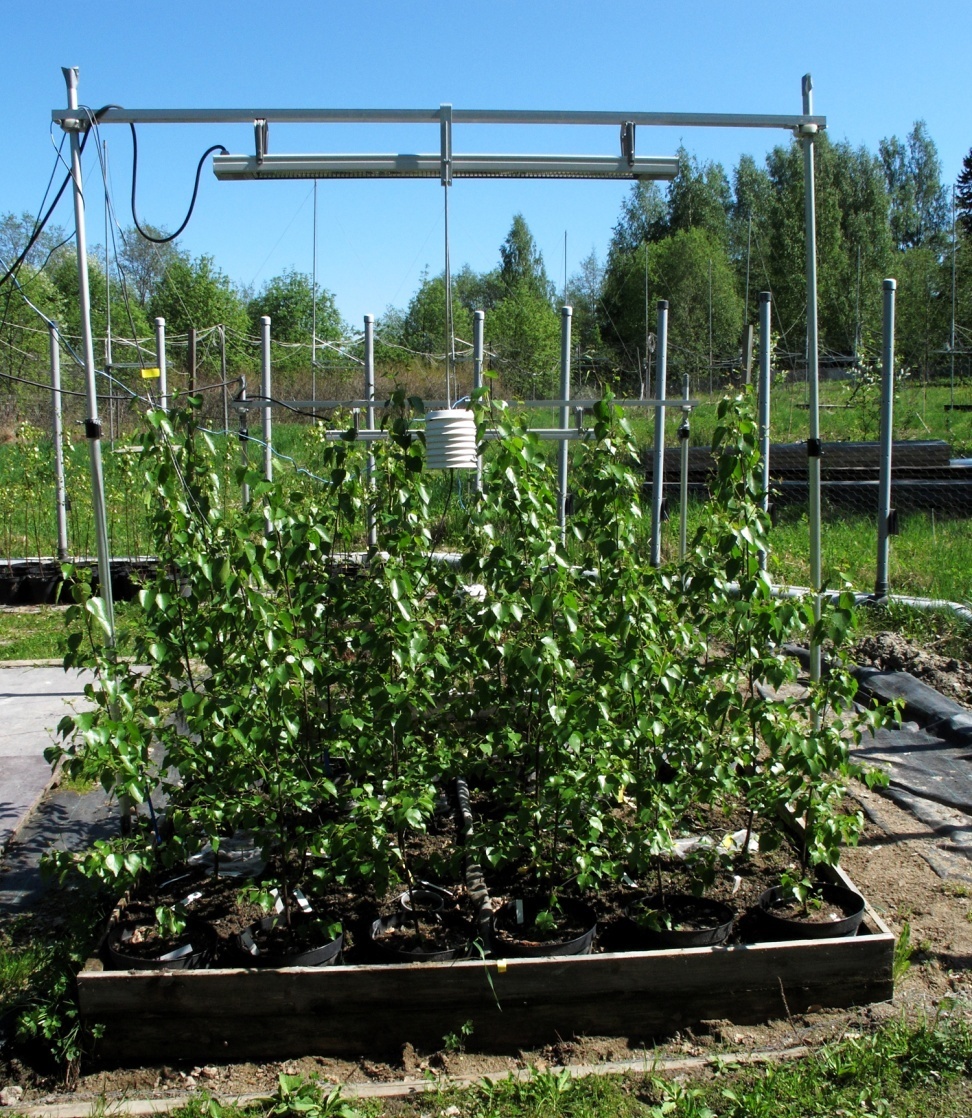
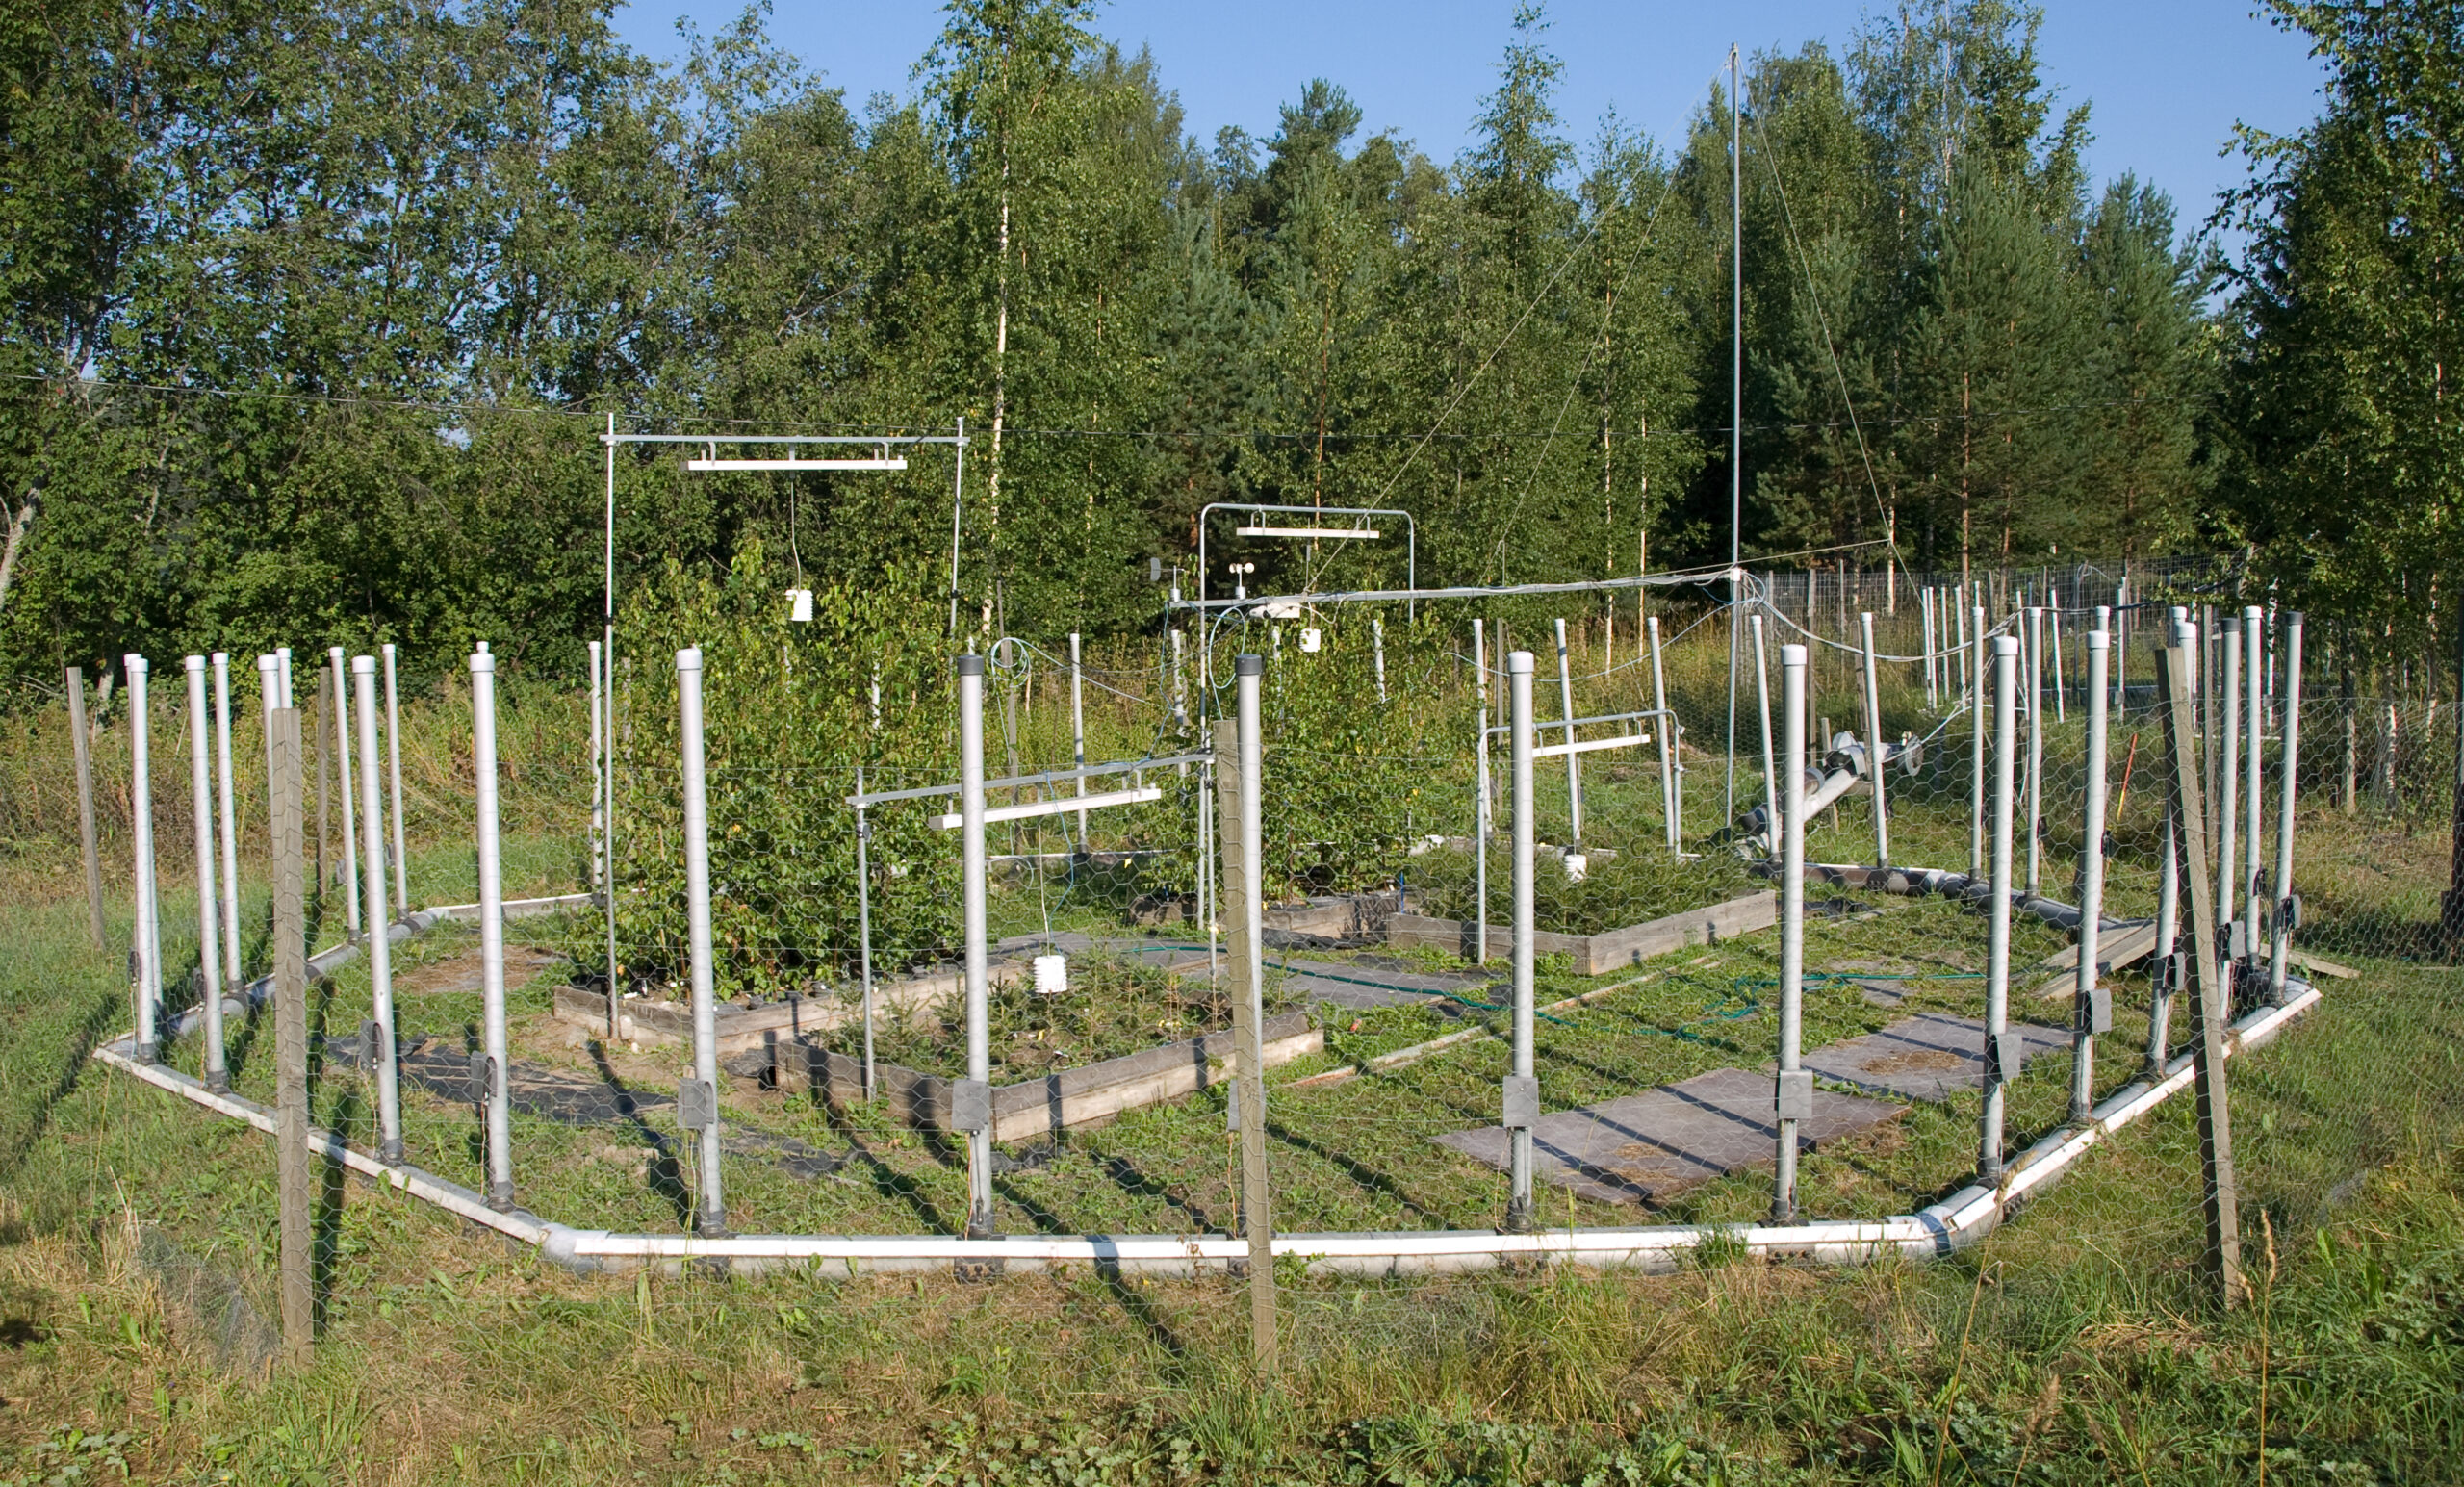
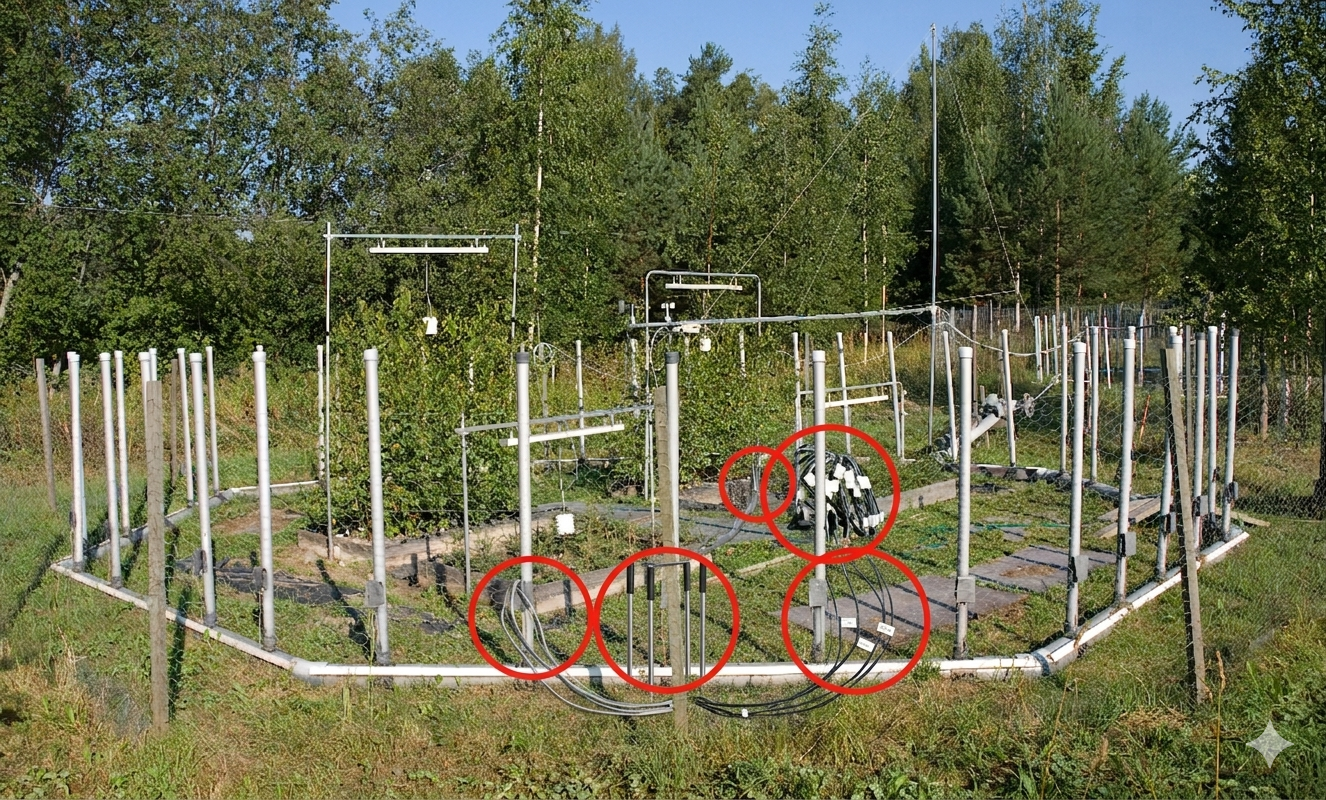
Their rugged construction and reliable performance matter significantly for unattended deployments in harsh weather conditions where equipment failure means lost data. In my experiment, this type of system handled the continuous monitoring of multiple environmental variables across eight experimental plots throughout the entire growing season, with all readings feeding back to the field cabin computer in real time.
IoT-enabled data loggers transmit data wirelessly in real time via cellular, LoRaWAN, or satellite networks. These are increasingly used where remote access to data is important, such as monitoring sites that are difficult to visit frequently or where early warning of anomalous conditions is needed. I find these particularly useful for large-scale monitoring networks where visiting each site regularly is simply not practical.
Low-cost open-source loggers based on Arduino or similar platforms have grown in popularity for research programmes that need dense sensor networks at lower cost. The trade-off is that they require more technical setup and ongoing maintenance than commercial systems. For researchers comfortable with basic electronics and programming, they offer genuine flexibility at a fraction of the cost of commercial alternatives.
What Do Data Loggers Measure in Environmental Research?
The range of parameters a data logger can record depends entirely on the sensors you connect to it.
In my field experiment the variables I monitored continuously were:
Air temperature and relative humidity.
These describe the atmospheric conditions surrounding plants and affect photosynthesis, transpiration, and growth rates. I recorded these at plot level throughout the growing season. Seeing these values update in real time on the cabin monitor was one of the most useful aspects of the whole setup.
Soil temperature
This drives microbial activity and therefore soil respiration and carbon cycling. I recorded soil temperature at 2 cm depth alongside every manual respiration measurement, but the continuous logger record filled in the picture between those monthly readings. The interaction between soil temperature and my treatment effects was only interpretable because I had that complete record.
Soil moisture
This interacts with temperature to control decomposition rates and affects how trees allocate carbon between roots and above-ground growth. On dry measurement days the temperature effect on soil respiration was often masked by moisture limitation. Having continuous moisture records helped me separate those effects in the analysis.
Ozone concentration
In my free-air ozone fumigation experiment, continuous ozone monitoring was essential to verify that treatment plots were receiving the intended concentration. Ozone is reactive and its concentration can fluctuate with wind and atmospheric conditions. Without continuous monitoring I would not have known whether the fumigation system was actually delivering what the experimental design required.
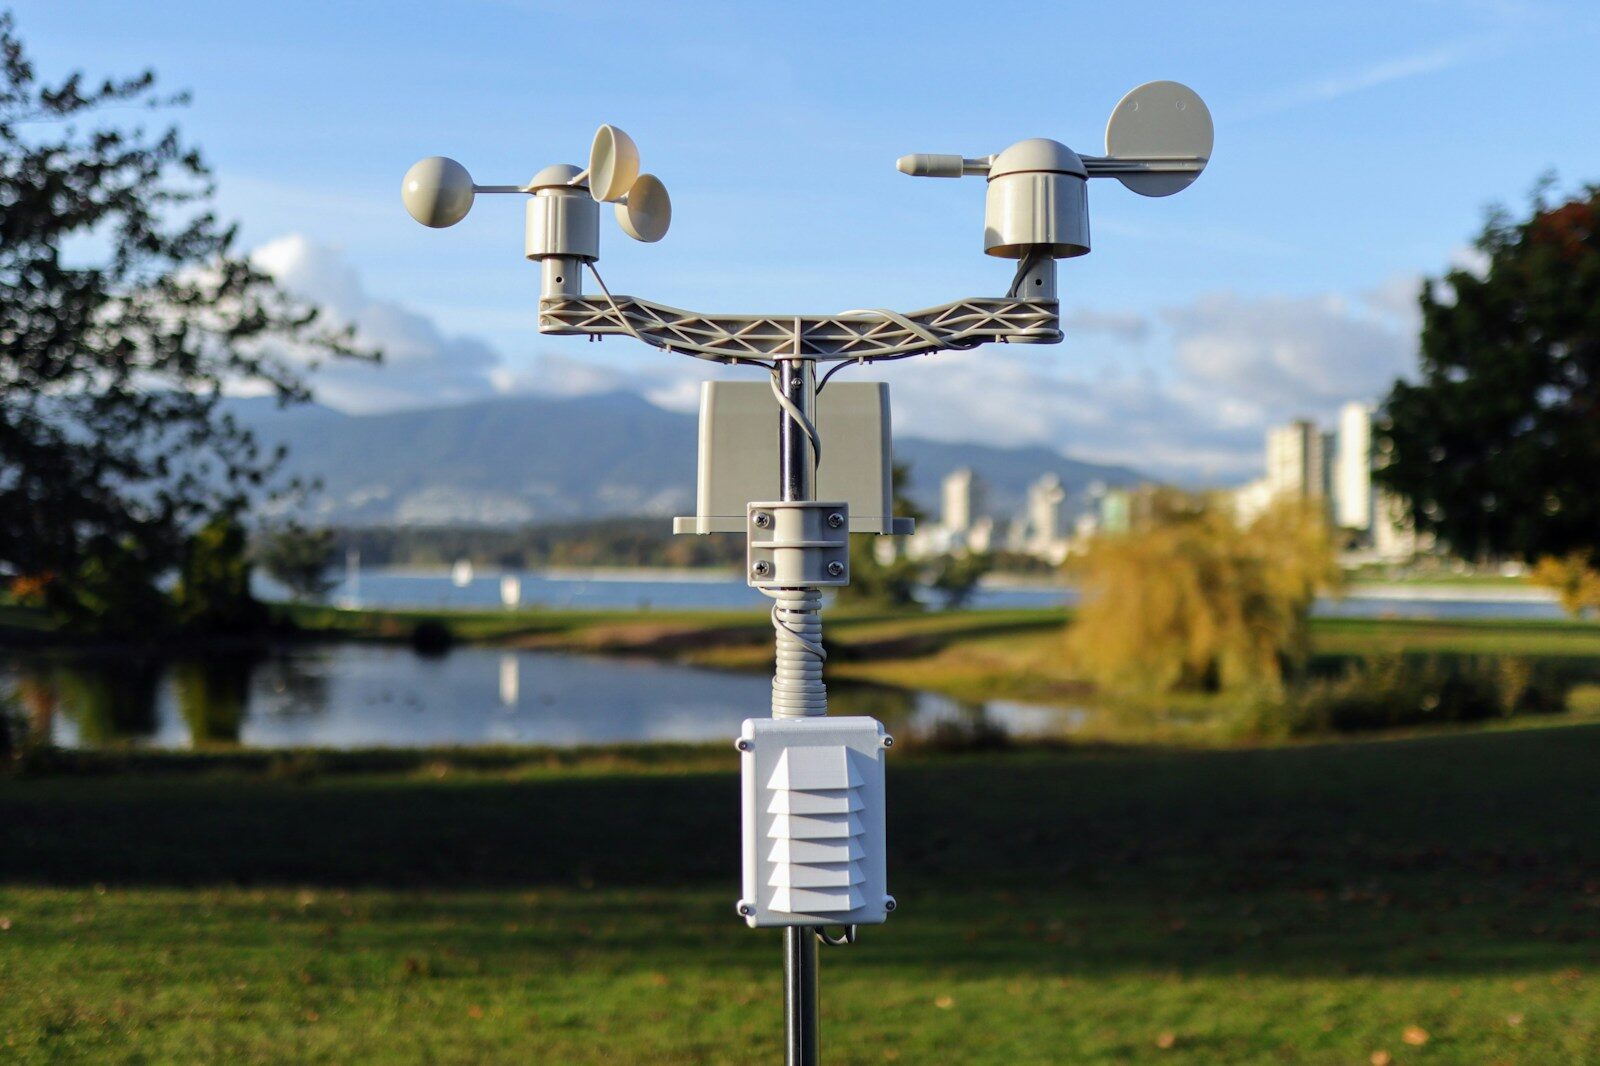
Wind speed and direction
Also monitored continuously to verify that ozone distribution across plots matched expectations and to understand how wind events might have affected treatment delivery on particular days.
How to Choose the Right Data Logger
Based on my experience, the right choice comes down to four things: how many sensors you need to connect, how long the deployment will last, whether you need remote data access, and your budget.
For a small student experiment or short-term monitoring project with two to four sensors, I would start with an entry-level standalone logger. They are affordable, simple to set up, and the associated software makes data download and basic visualisation straightforward.
For a multi-sensor research experiment running over one or more growing seasons, a research-grade multi-channel system offers the reliability and flexibility that serious field work demands. The initial cost is higher but the long-term data quality justifies it for funded research programmes. If the budget and setup allow it, connecting everything to a central monitoring computer the way I had at my field site adds a layer of real-time oversight that is genuinely valuable.
For large-scale monitoring networks where visiting each site frequently is impractical, IoT-enabled loggers with remote transmission reduce the site visit burden and allow real-time data quality checks from anywhere.
One practical consideration that is easy to overlook: battery life. In a remote field site, a logger that runs out of power halfway through your experiment is a serious problem. Always verify battery life against your planned logging interval and number of connected sensors before deployment. I would also strongly recommend a backup power plan for any deployment longer than a few weeks.
What I Would Tell Someone Setting Up Their First Data Logger System
Based on running continuous monitoring through a full growing season, a few things stand out that I wish I had been more deliberate about from the start.
Set your logging interval carefully before deployment. Logging every minute generates enormous files that are slow to process and rarely necessary. Logging every 30 minutes is standard for most environmental parameters and gives you sufficient resolution to capture meaningful variation without overwhelming your storage.
If your experiment allows it, set up a central point where you can view live readings from all sensors simultaneously. In my case this was a computer in the field cabin connected to the full sensor network across all plots. Being able to see the whole system at once rather than checking each logger individually saved considerable time and caught problems early that might otherwise have gone unnoticed for days. Even a simple laptop running logging software can serve this purpose in a small experiment.
Download and check your data regularly even if you do not need it yet. Catching a sensor failure or calibration drift early in the deployment saves the entire dataset. A sensor that drifted for two weeks undetected is far more damaging than one you caught and replaced within days.
Keep a written site log. Every time you visit the logger, note the conditions, any equipment changes, and anything unusual you observed. This qualitative record becomes invaluable when you are trying to explain anomalies in the data months later during analysis.
And test everything at the bench before you go to the field. Checking sensor connections, battery levels, logging intervals, and data download in a controlled environment before deployment catches most problems before they become expensive mistakes in the field.
Frequently Asked Questions
What is a data logger used for in environmental research?
Recording environmental conditions continuously and automatically over time. In field experiments, data loggers capture temperature, humidity, soil moisture, wind, ozone, and other variables around the clock so researchers can understand the full context of their measurements.
How do data loggers work?
Sensors connected to the logger convert physical conditions into electrical signals. The logger translates these into readable values, timestamps them using an internal clock, and stores them in onboard memory. Data is downloaded manually or transmitted wirelessly depending on the system. In a more sophisticated setup, multiple loggers feed into a central monitoring computer that displays real-time readings across all measurement points simultaneously.
What is the difference between entry-level and research-grade data loggers?
Entry-level loggers handle fewer sensors, have simpler software, and cost significantly less. Research-grade systems support more sensors simultaneously, offer greater measurement precision, and are built for long-term unattended deployment in harsh outdoor conditions. For a student project, entry-level is usually sufficient. For a multi-year field experiment, research-grade is worth the investment.
How much does a data logger cost?
Entry-level standalone loggers start from around 50 to 150 USD for simple temperature and humidity units. Research-grade multi-channel systems typically cost 1,000 to 3,000 USD or more depending on configuration. IoT-enabled systems add connectivity costs on top of hardware.
Who uses data loggers in environmental research?
University researchers running field experiments, government environmental monitoring agencies, forestry and agricultural research programmes, climate change study sites, and ecological monitoring networks all rely on data loggers for continuous environmental measurement.
How should data loggers be used for best results?
Choose a logging interval appropriate to your research question. Check and download data regularly during deployment. Use a backup power source for remote sites. Keep a site visit log. Test all sensors before going to the field. Where possible, connect sensors to a central monitoring point so you can see the full picture in real time.
What parameters did you monitor in your own field experiment?
Air temperature, relative humidity, soil temperature at 2 cm depth, soil moisture, ozone concentration, wind speed, and wind direction. All recorded continuously throughout the growing season and fed into a central monitoring computer in a field cabin at the site. That real-time overview of all variables across all plots was one of the most valuable aspects of the whole experimental setup.