



Is Your Tree Storing More Carbon Than Its Soil Releases?
This tool was built by Serge (MSc) using established science and government sources. My academic background covers Biogeochemistry, Forest Science, Environmental Biology, and Plant Biology, and my field research directly measured soil carbon and tree growth in open-air experiments. My tools are for educational purposes and give practical guidance, not professional advice.
Inspired by my silver birch field experiment
Trees take carbon dioxide out of the air and lock the carbon away in their trunk, branches and roots. At the same time, the soil under them breathes carbon dioxide back out, as roots respire and soil microbes break down fallen leaves and old organic matter.
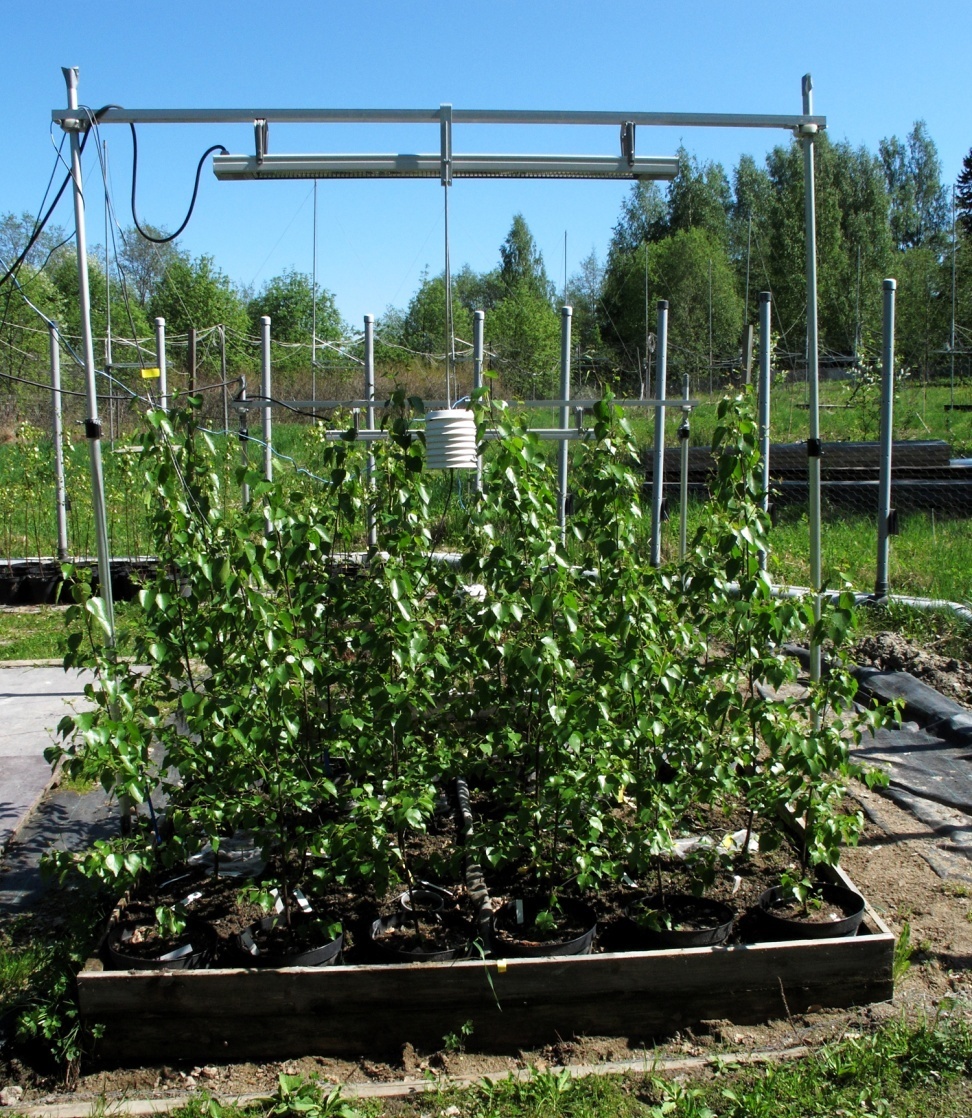
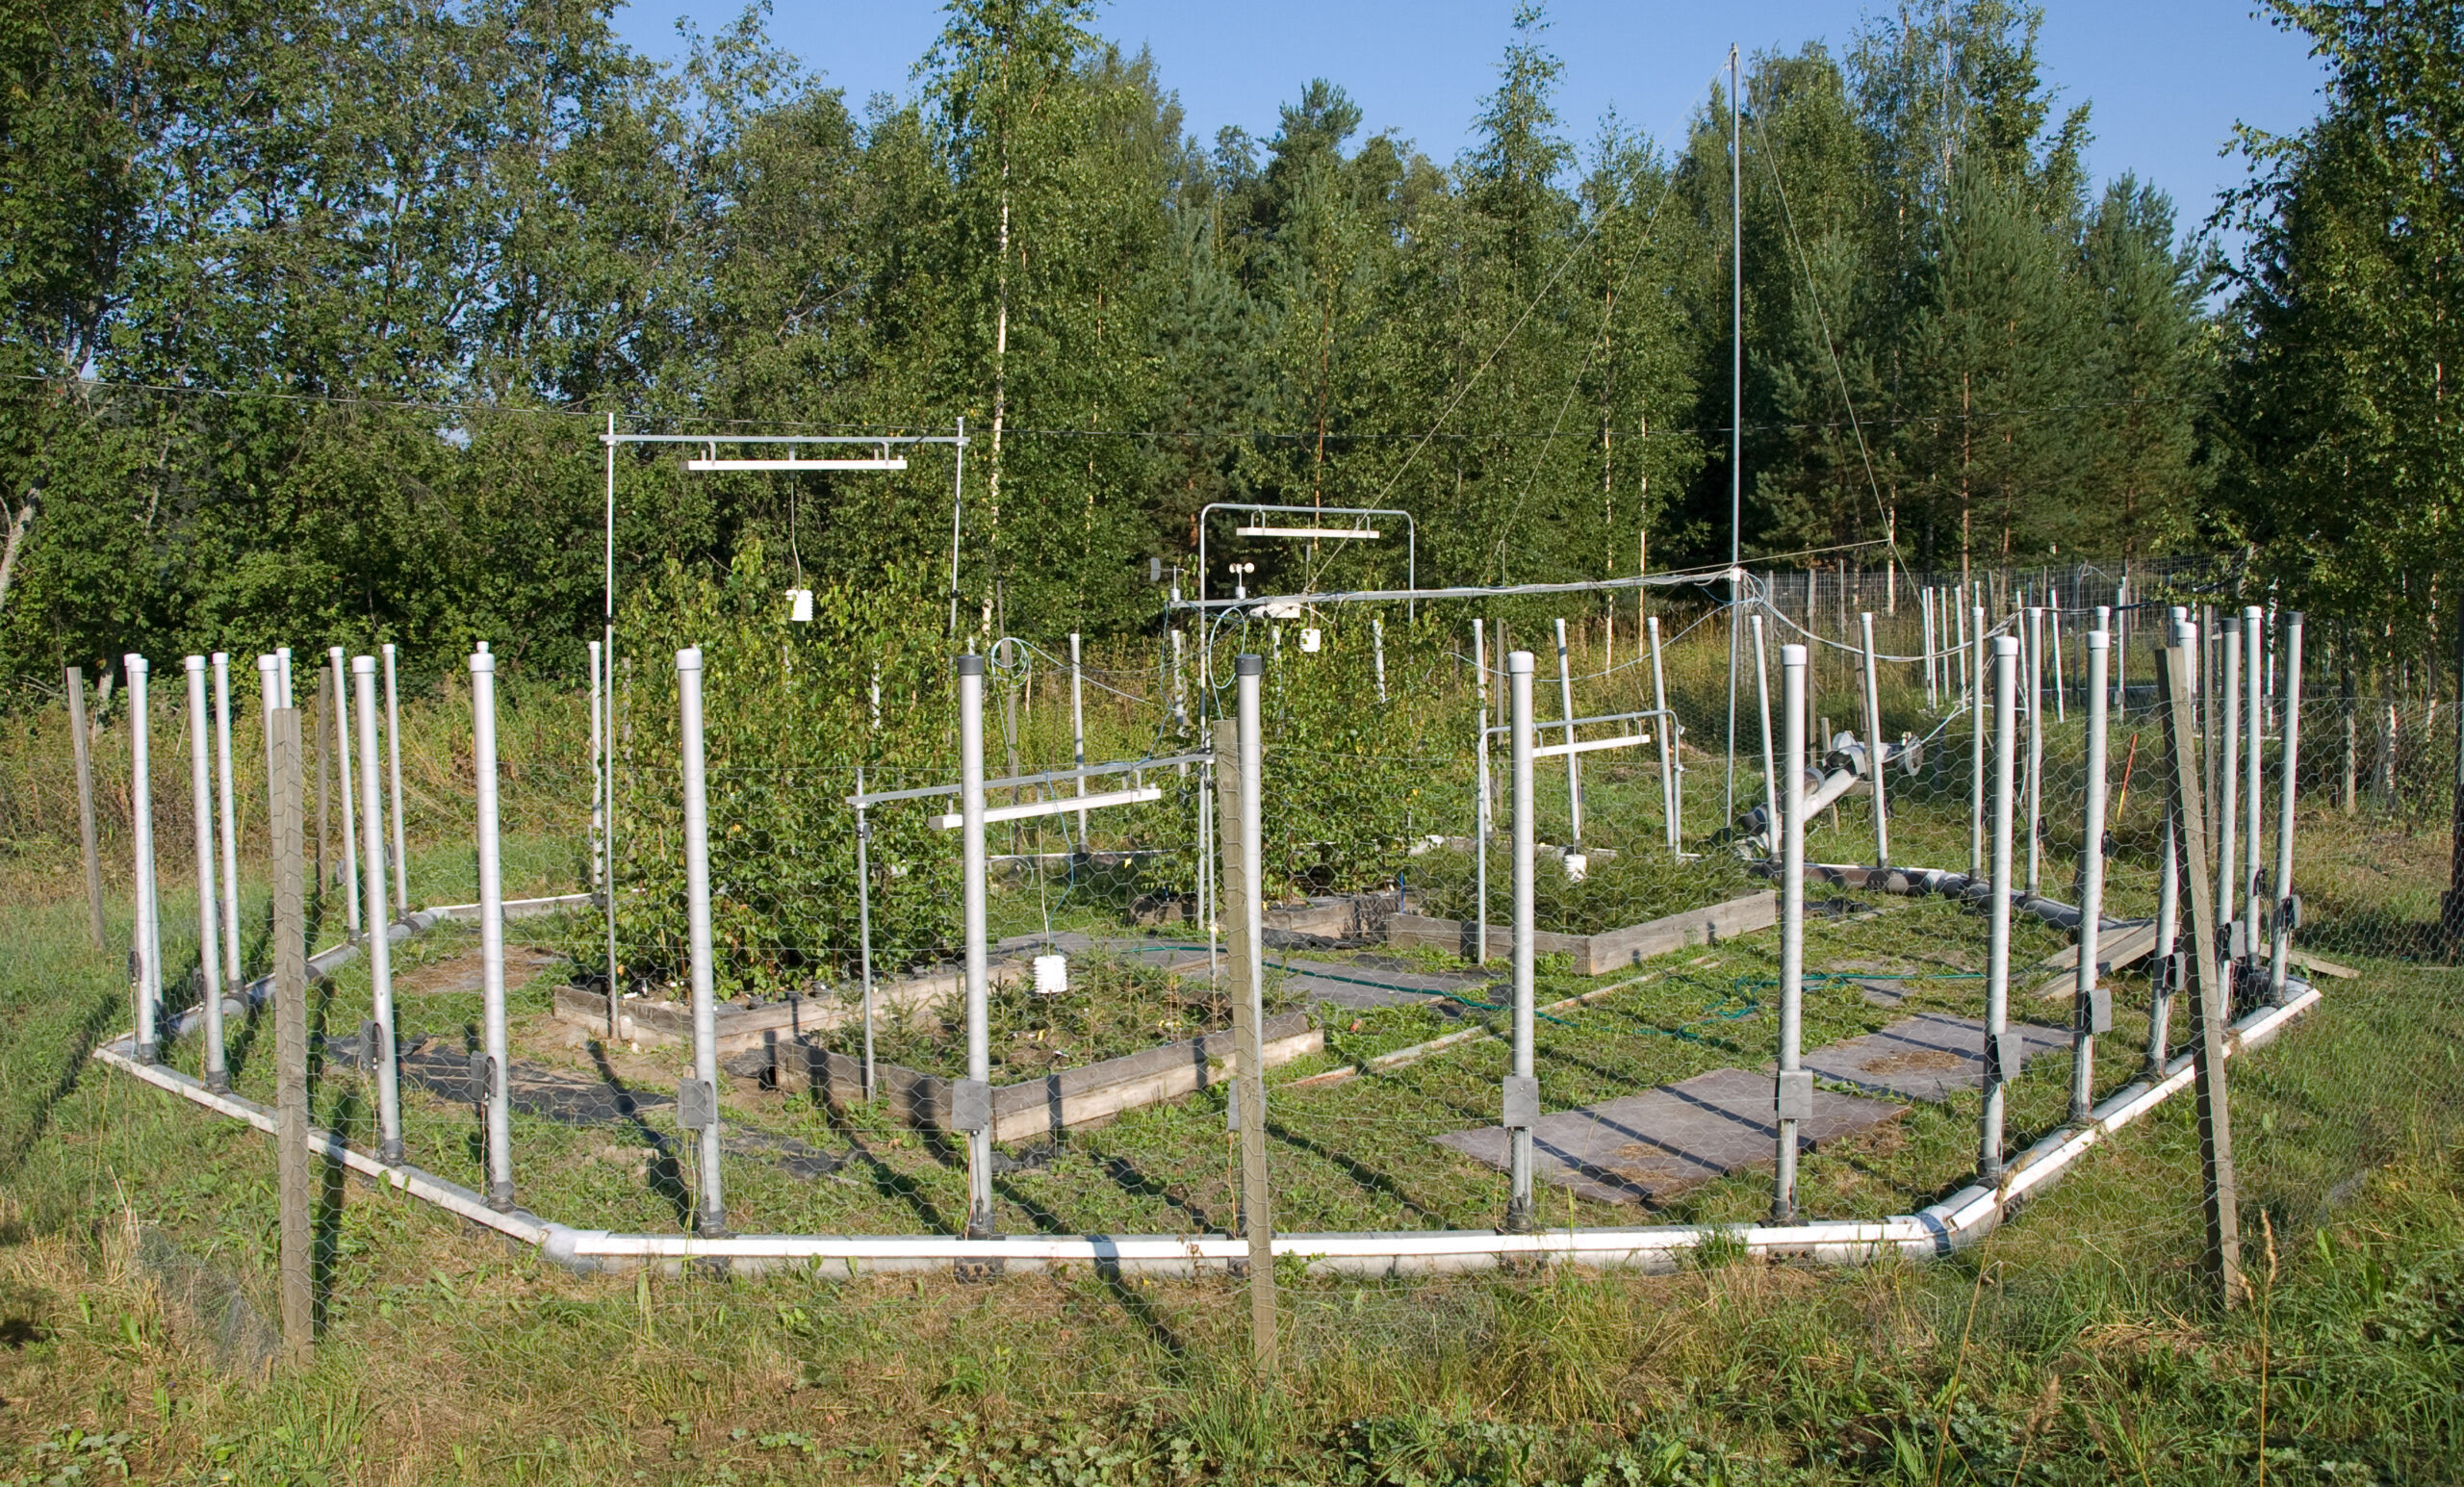
The idea for this tool came from my own open-air field experiment on silver birch. Infrared heaters warmed the plots by just 0.9 °C, and that small rise increased soil respiration by 24 to 36%, depending on the birch genotype. It left me with one question: is a tree storing more carbon than a warmer soil gives back?
The general pattern, that warmer soil breathes out more carbon dioxide, has been found in research around the world. How strongly it happens differs between species, between individual trees and between sites, because every plant has its own physiology and every soil its own life. So this tool gives you an educational estimate: a way to satisfy your curiosity and get an overview of how your own tree and its soil exchange carbon with the air, not an exact measurement.
You do not need any science background, only a tape measure. Each box below tells you exactly what to enter, and if you are unsure, press Show me an example first.
How to Read Your Result
The tool gives you four numbers. The first is the carbon your tree locks away each year in new wood and roots. The second is everything the soil under the crown breathes out in a year. Most of that is a natural cycle: roots breathing, and microbes eating last year's fallen leaves. A healthy tree keeps feeding that cycle with new leaves, so it does not drain the soil.
The third number is the share that comes from microbes breaking down leaf litter and soil organic matter. The fourth is the part that counts for the climate question: the extra carbon dioxide this soil would release if it warmed by the amount you chose. That extra release comes from carbon the soil had been storing.
The verdict compares the extra soil release with what your tree stores. If the tree stores far more, your tree is a strong carbon store even in a warmer world. If the two are close, warming is eating into the benefit. You will see a range, low to high, because soils differ in how strongly they respond to heat.
Is My Tree Polluting the Air?
No. The carbon dioxide the soil breathes out is part of a natural cycle: the tree feeds the soil with leaves and roots, and the soil returns some of that carbon to the air. A healthy, growing tree takes in more carbon than it gives back, which is why the net figure in your result is the one to look at. It only becomes a concern when warming makes soils release carbon they had been storing for years, and that is the extra release this tool estimates.
Did you know? Trees also release small amounts of natural gases called volatile organic compounds. They give pine forests their scent, and oaks, poplars and willows release one called isoprene. On hot, sunny days in polluted cities, these gases can react with traffic fumes and add a little to ground-level ozone. Their share is small compared with traffic and industry, and planting trees still does far more good than harm. If you want to know more, I explain how ozone stresses forests in a separate article.
How This Works
The tree side. The tool turns your trunk size into the dry weight of the whole tree above ground, using the species-group equations published by the US Forest Service. It adds the coarse roots with the matching root equation, then compares this year's size with last year's to find the new wood added in one year. About 47% of dry wood is carbon, and every kilogram of carbon equals about 3.67 kg of carbon dioxide taken from the air.
The soil side. The tool starts from the average yearly soil respiration measured for your type of climate, applies it to the area under the crown, and adjusts it for dry or wet soil. In forests, a little under half of soil respiration comes from roots and the rest from microbes, so the tool treats about 54% as microbial.
The warming. Soil respiration speeds up with temperature. Scientists describe this with a number called Q10: how many times faster respiration runs for every 10 °C of warming. Across the world's soils, the median Q10 is about 2.4. The tool uses a range of 2 to 3 for the low and high estimates. Dry soil responds less to warming, which matched what I saw in my own plots, so the tool halves the warming effect for dry soil.
What My Field Experiment Showed
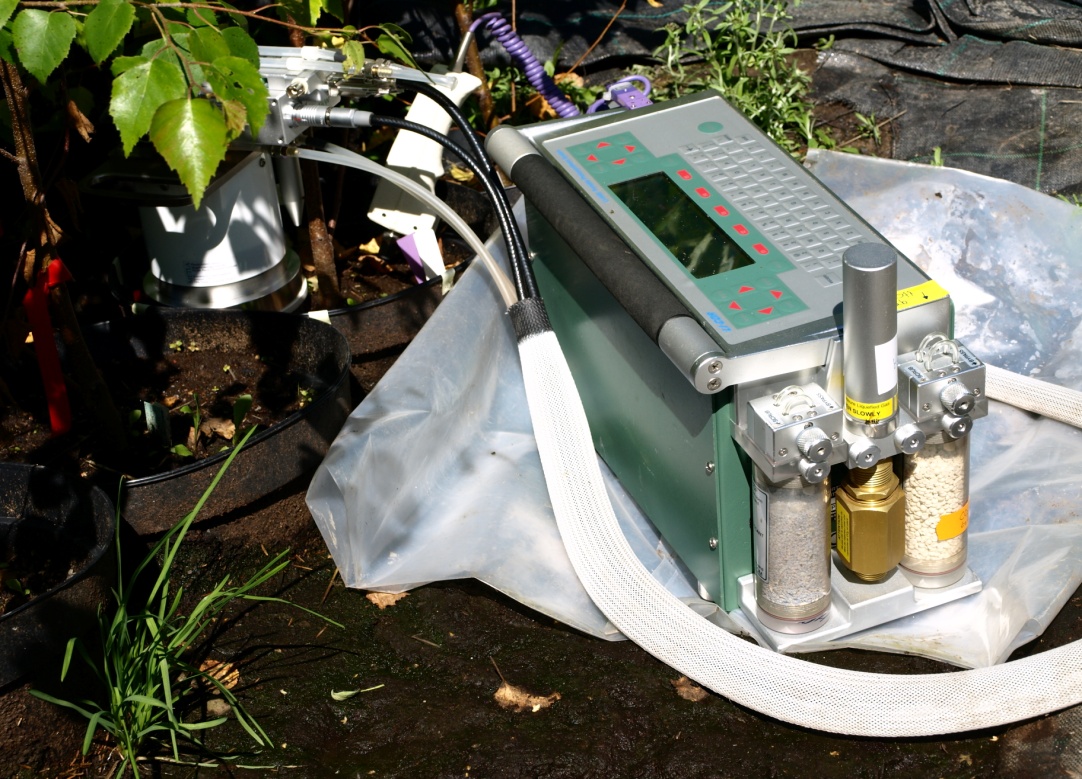
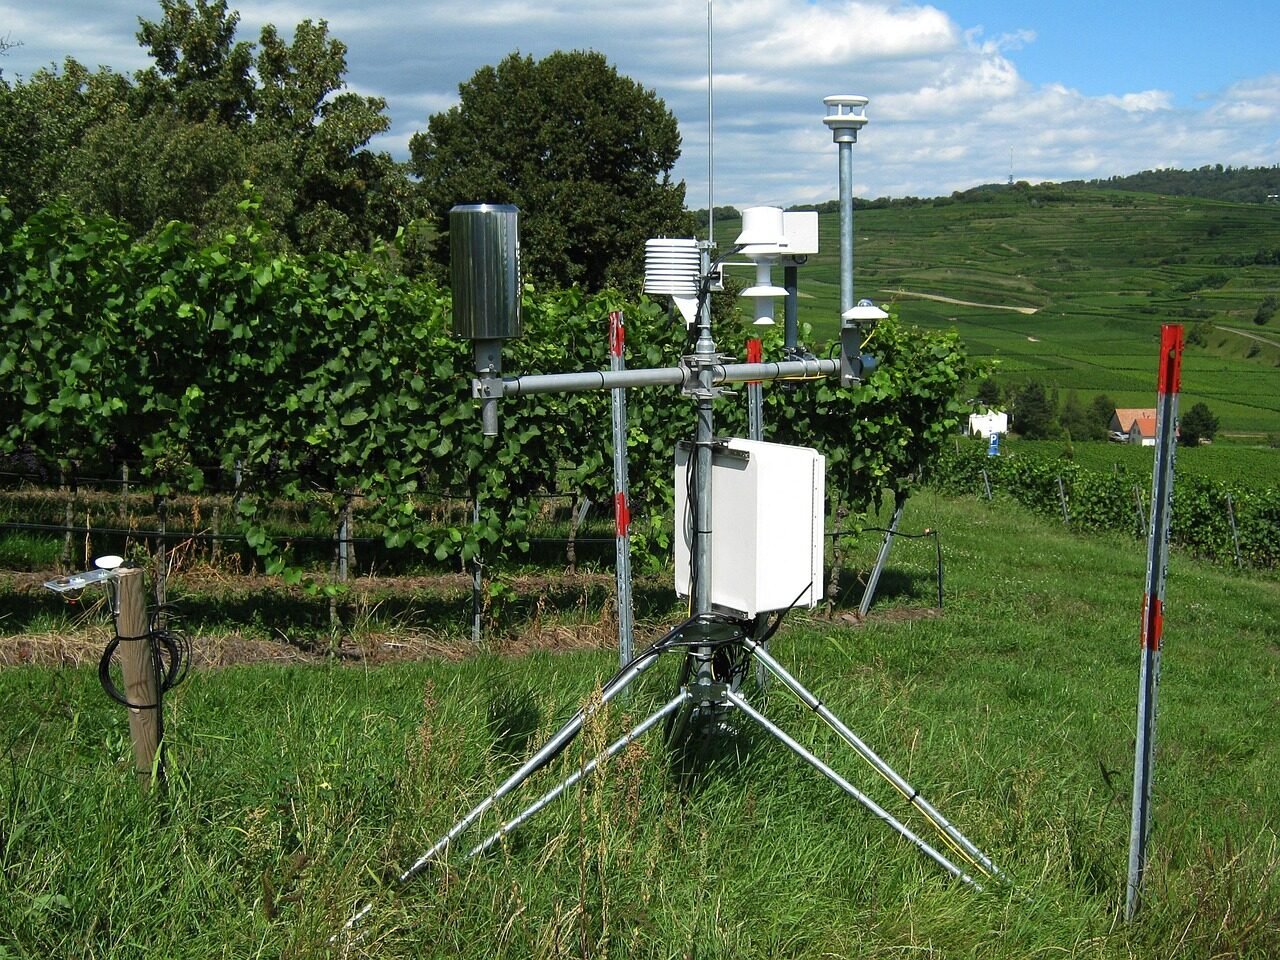
In my experiment, I measured soil respiration with a LI-COR 6400-09 chamber, paired with soil temperature and moisture, under two silver birch genotypes. A warming of 0.9 °C raised soil respiration by 24% in one genotype and 36% in the other, within a single growing season. That is a much bigger jump than the long-term averages this tool uses predict.
Short-term responses like these are often stronger than what happens over many years, because the most easily decomposed carbon is used up first and roots and microbes adjust. That is why I keep the tool on the careful side, with the standard Q10 range. It also shows why genotype is important: two birches of the same species gave soils that reacted differently to the same warming.
What You Can Do to Keep More Carbon
Leave fallen leaves under trees and shrubs where you can, or add them to compost. A layer of mulch keeps soil cooler and more evenly moist, which slows the warming effect on soil microbes, and my Tree Watering & Mulch Calculator shows how much to use. Avoid digging over the soil under trees, because disturbance speeds up the loss of soil carbon. And the simplest step of all: keep your tree healthy, because a fast-growing tree stores far more carbon each year than a struggling one.
Important Limitations
This is an estimate, not a measurement. The tree equations were built from many trees of each species group, and any single tree can differ. They are designed for trunks at least 2.5 cm across, so results for very young trees are rough.
The soil figures are averages for broad climate types. Your soil could release noticeably more or less depending on its organic matter, texture and drainage. The tool also leaves out leaves, fine roots and fallen litter on the tree side, because those return to the soil within a few years. It counts only the carbon stored long term in wood and coarse roots, which makes the tree side of the comparison conservative.
Finally, the warming result assumes the tree keeps growing at the same rate. In reality, a little warming can help some trees grow while drought or heat stress can slow them down.
Scientific Basis
The tree biomass and root equations come from the national-scale species-group equations of Jenkins and colleagues at the US Forest Service. The carbon fraction of wood follows the default value in the IPCC guidelines for national greenhouse gas inventories. Soil respiration by climate type and the median Q10 of 2.4 come from the global synthesis by Raich and Schlesinger, and the split between root and microbial respiration comes from the review by Hanson and colleagues.
- Jenkins, Chojnacky, Heath and Birdsey (2003), National-scale biomass estimators for United States tree species, Forest Science 49: 12–35 (tree and root biomass equations)
- IPCC (2006), Guidelines for National Greenhouse Gas Inventories, Volume 4, Chapter 4: Forest Land (carbon fraction of wood)
- Raich and Schlesinger (1992), The global carbon dioxide flux in soil respiration and its relationship to vegetation and climate, Tellus B 44: 81–99 (soil respiration by climate and Q10)
- Hanson, Edwards, Garten and Andrews (2000), Separating root and soil microbial contributions to soil respiration, Biogeochemistry 48: 115–146 (root and microbial share)
Related Reading
- What Is the Soil Carbon Cycle? Evidence from Silver Birch Field Experiments (the experiment behind this tool)
- How Do Trees Use Carbon? (where a tree puts the carbon it takes in)
- Soil Carbon Stock Calculator (how much carbon your soil holds right now)
- Stem Diameter & Girth Converter (switch between girth and diameter)
- Tree Establishment Tracker (record your tree's growth year after year)
This calculator gives an educational estimate from the figures you enter and published averages. Every tree, species and site behaves a little differently, so it is not a substitute for field measurement or a verified carbon assessment.