


Accurate environmental data depends on well-calibrated instruments and careful field methods.
In my research with silver birch (Betula pendula), I learned that monitoring without proper systems or protocols produces incomplete or misleading results. Using controlled temperature and ozone treatments, I tracked stem growth, leaf area, and soil CO₂ flux, showing how systematic fieldwork supports reliable conclusions.
Environmental monitoring is not just recording numbers; it involves structured systems, precise tools, and consistent methods.
This article explains what environmental monitoring systems (EMS) are, the tools I used, how fieldwork is done, and how data is analyzed, based on my own hands-on field experience.
What Is an Environmental Monitoring System (EMS)?
An Environmental Monitoring System (EMS) integrates hardware and software to measure environmental conditions automatically and repeatedly.
Key components of an EMS include:
Sensors for air, soil, water, and biological variables.
Data loggers to record and store measurements continuously.
Software platforms to manage, analyze, and visualize data.
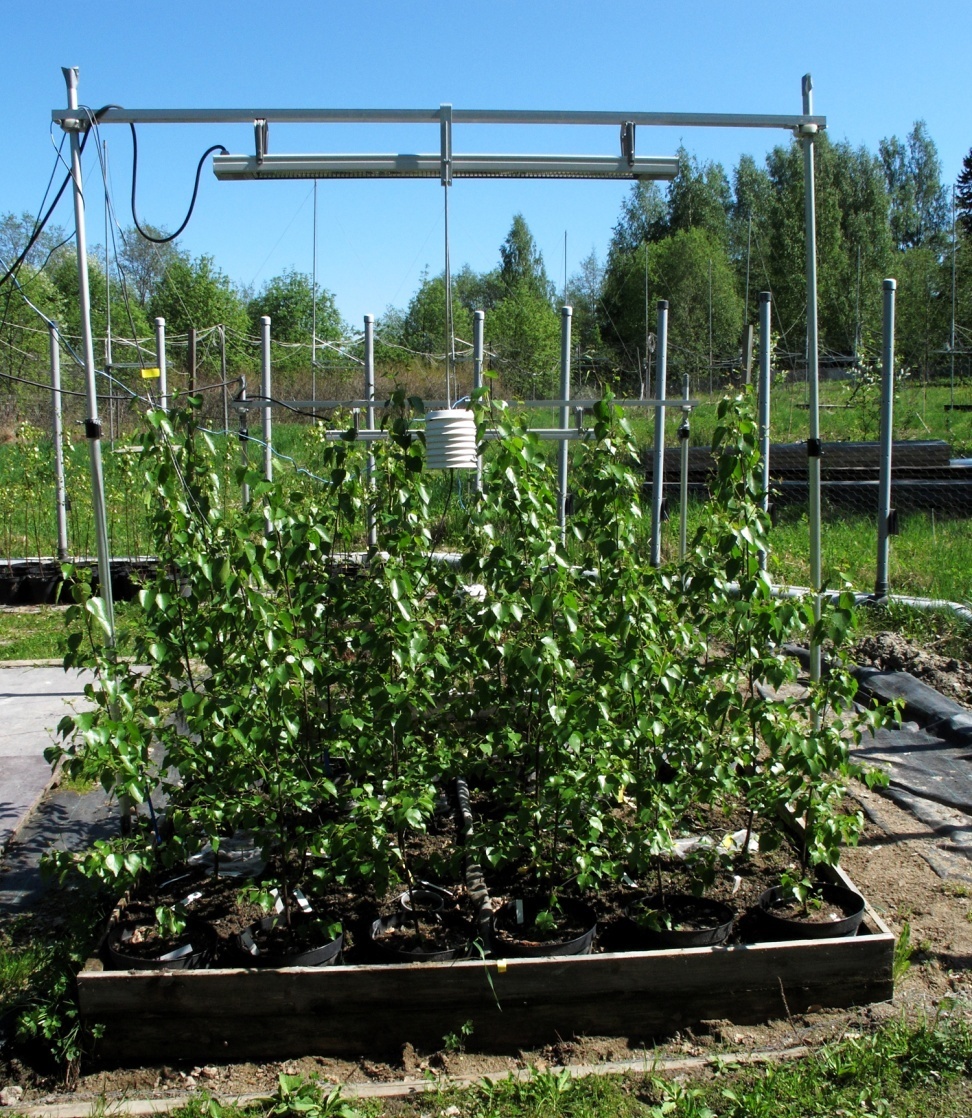
In my silver birch study, I used:
Air and soil temperature sensors.
Soil moisture probes.
Ozone monitoring equipment.
Data loggers capturing readings over several months.
This EMS setup allowed me to detect small but meaningful differences between control plots and treatment plots, which would have been impossible with manual measurements alone.
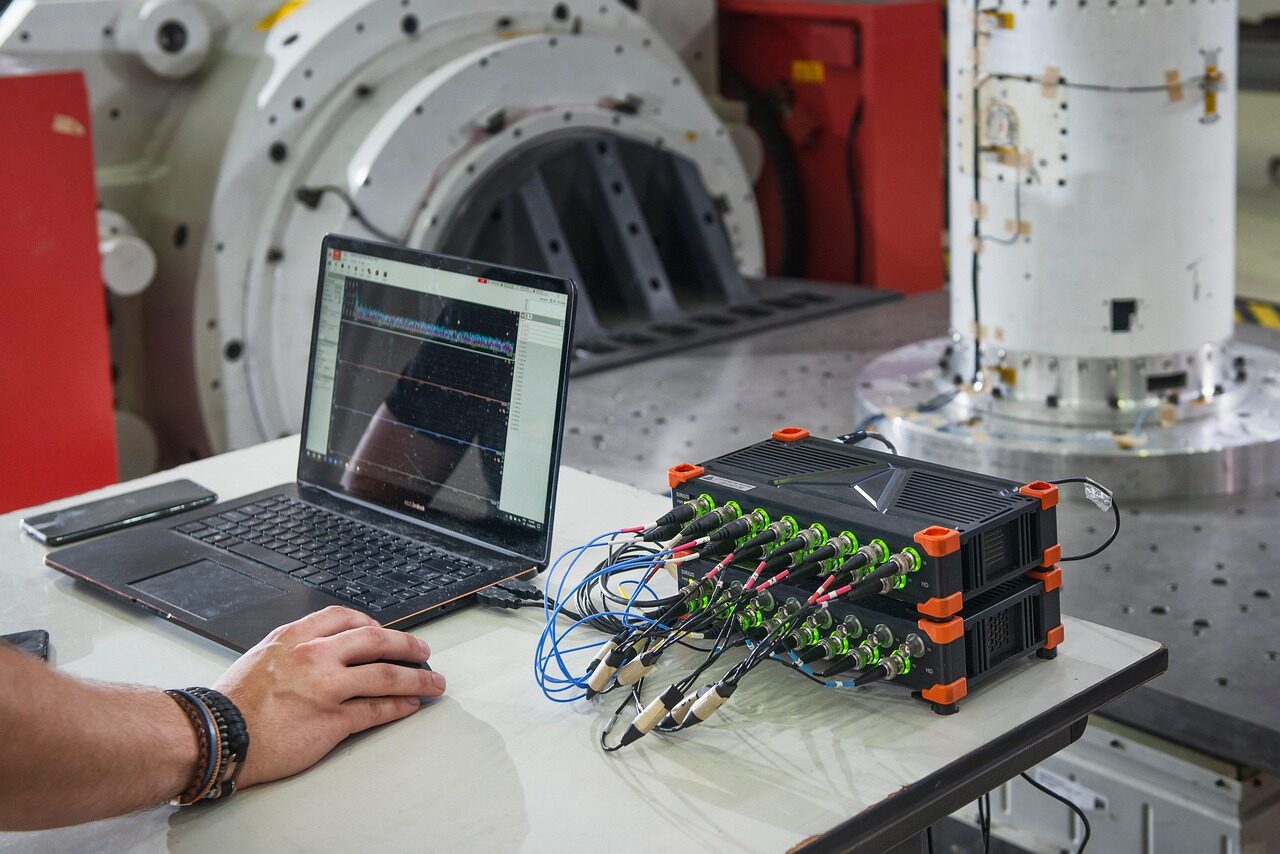
How Computers Improve Monitoring
Modern EMS relies on computers and software tools to handle large datasets and detect patterns. In my research, I had a dedicated computer installed in a small field cabin, connected via wires and connectors to all sensors in the plots. This setup allowed me to:
Monitor ozone levels and soil moisture in real time.
Record continuous measurements without manually checking each sensor.
Detect trends such as soil CO₂ flux increases under warming and genotype-specific responses.
Store data safely and transfer it for analysis.
The wired setup ensured stable data transmission, which is especially important in field conditions where wireless signals can be inconsistent. Computers made it possible to compare trends across treatments efficiently and accurately.
Essential Environmental Monitoring Tools
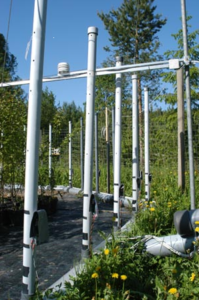
Atmospheric Tools
Ozone exposure systems (similar to FACE): Controlled ozone levels in open-air plots. I elevated ozone to 33.4 ppb compared to ambient 24.2 ppb.
Gas analyzers: Measured CO₂ and O₃ levels to track air quality and pollutant effects.
These tools helped me determine how ozone affected tree growth and stem diameter over a season.
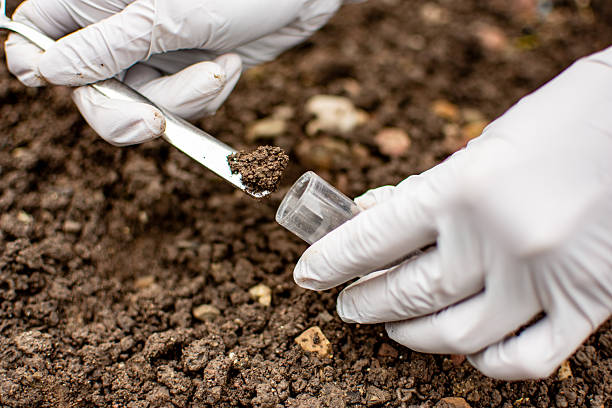
Soil and Terrestrial Tools
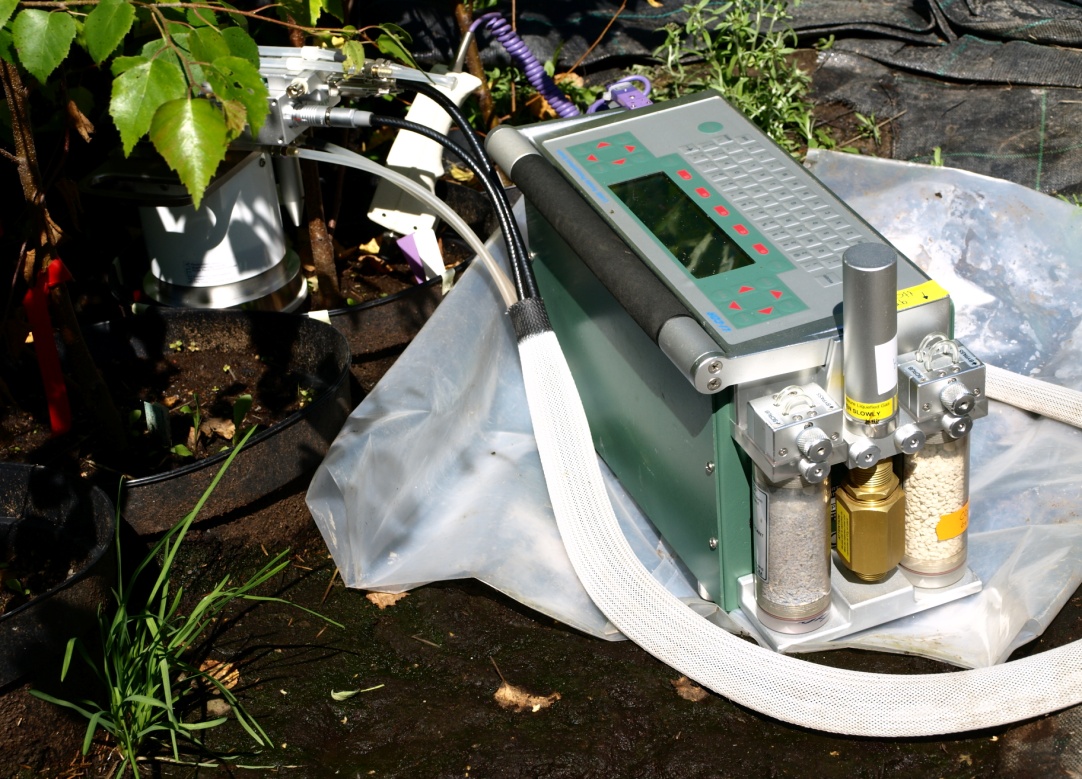
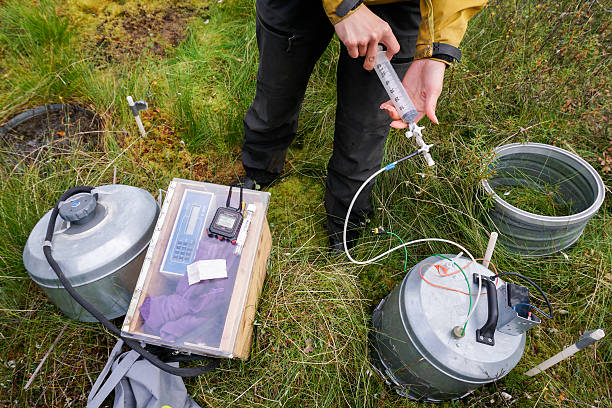
Soil CO₂ flux chambers (LICOR 6400-09): Measured carbon dioxide released from soil.
Soil probes: Recorded temperature, moisture, and nutrient levels that influence root and microbial activity.
Measurements showed that moderate warming increased soil CO₂ efflux, a key indicator of ecosystem carbon cycling.
Biological Tools
Vernier calipers: Measured stem diameter with millimeter accuracy.
Leaf scanners and counts: Tracked leaf number and total leaf area to assess photosynthetic potential.
These tools revealed genotype-specific responses: one genotype had more leaves and higher growth under warming, while the other responded differently.
Step-by-Step Guide to Environmental Monitoring in the Field
Performing reliable environmental monitoring requires structured steps.
In my research, I followed this workflow:
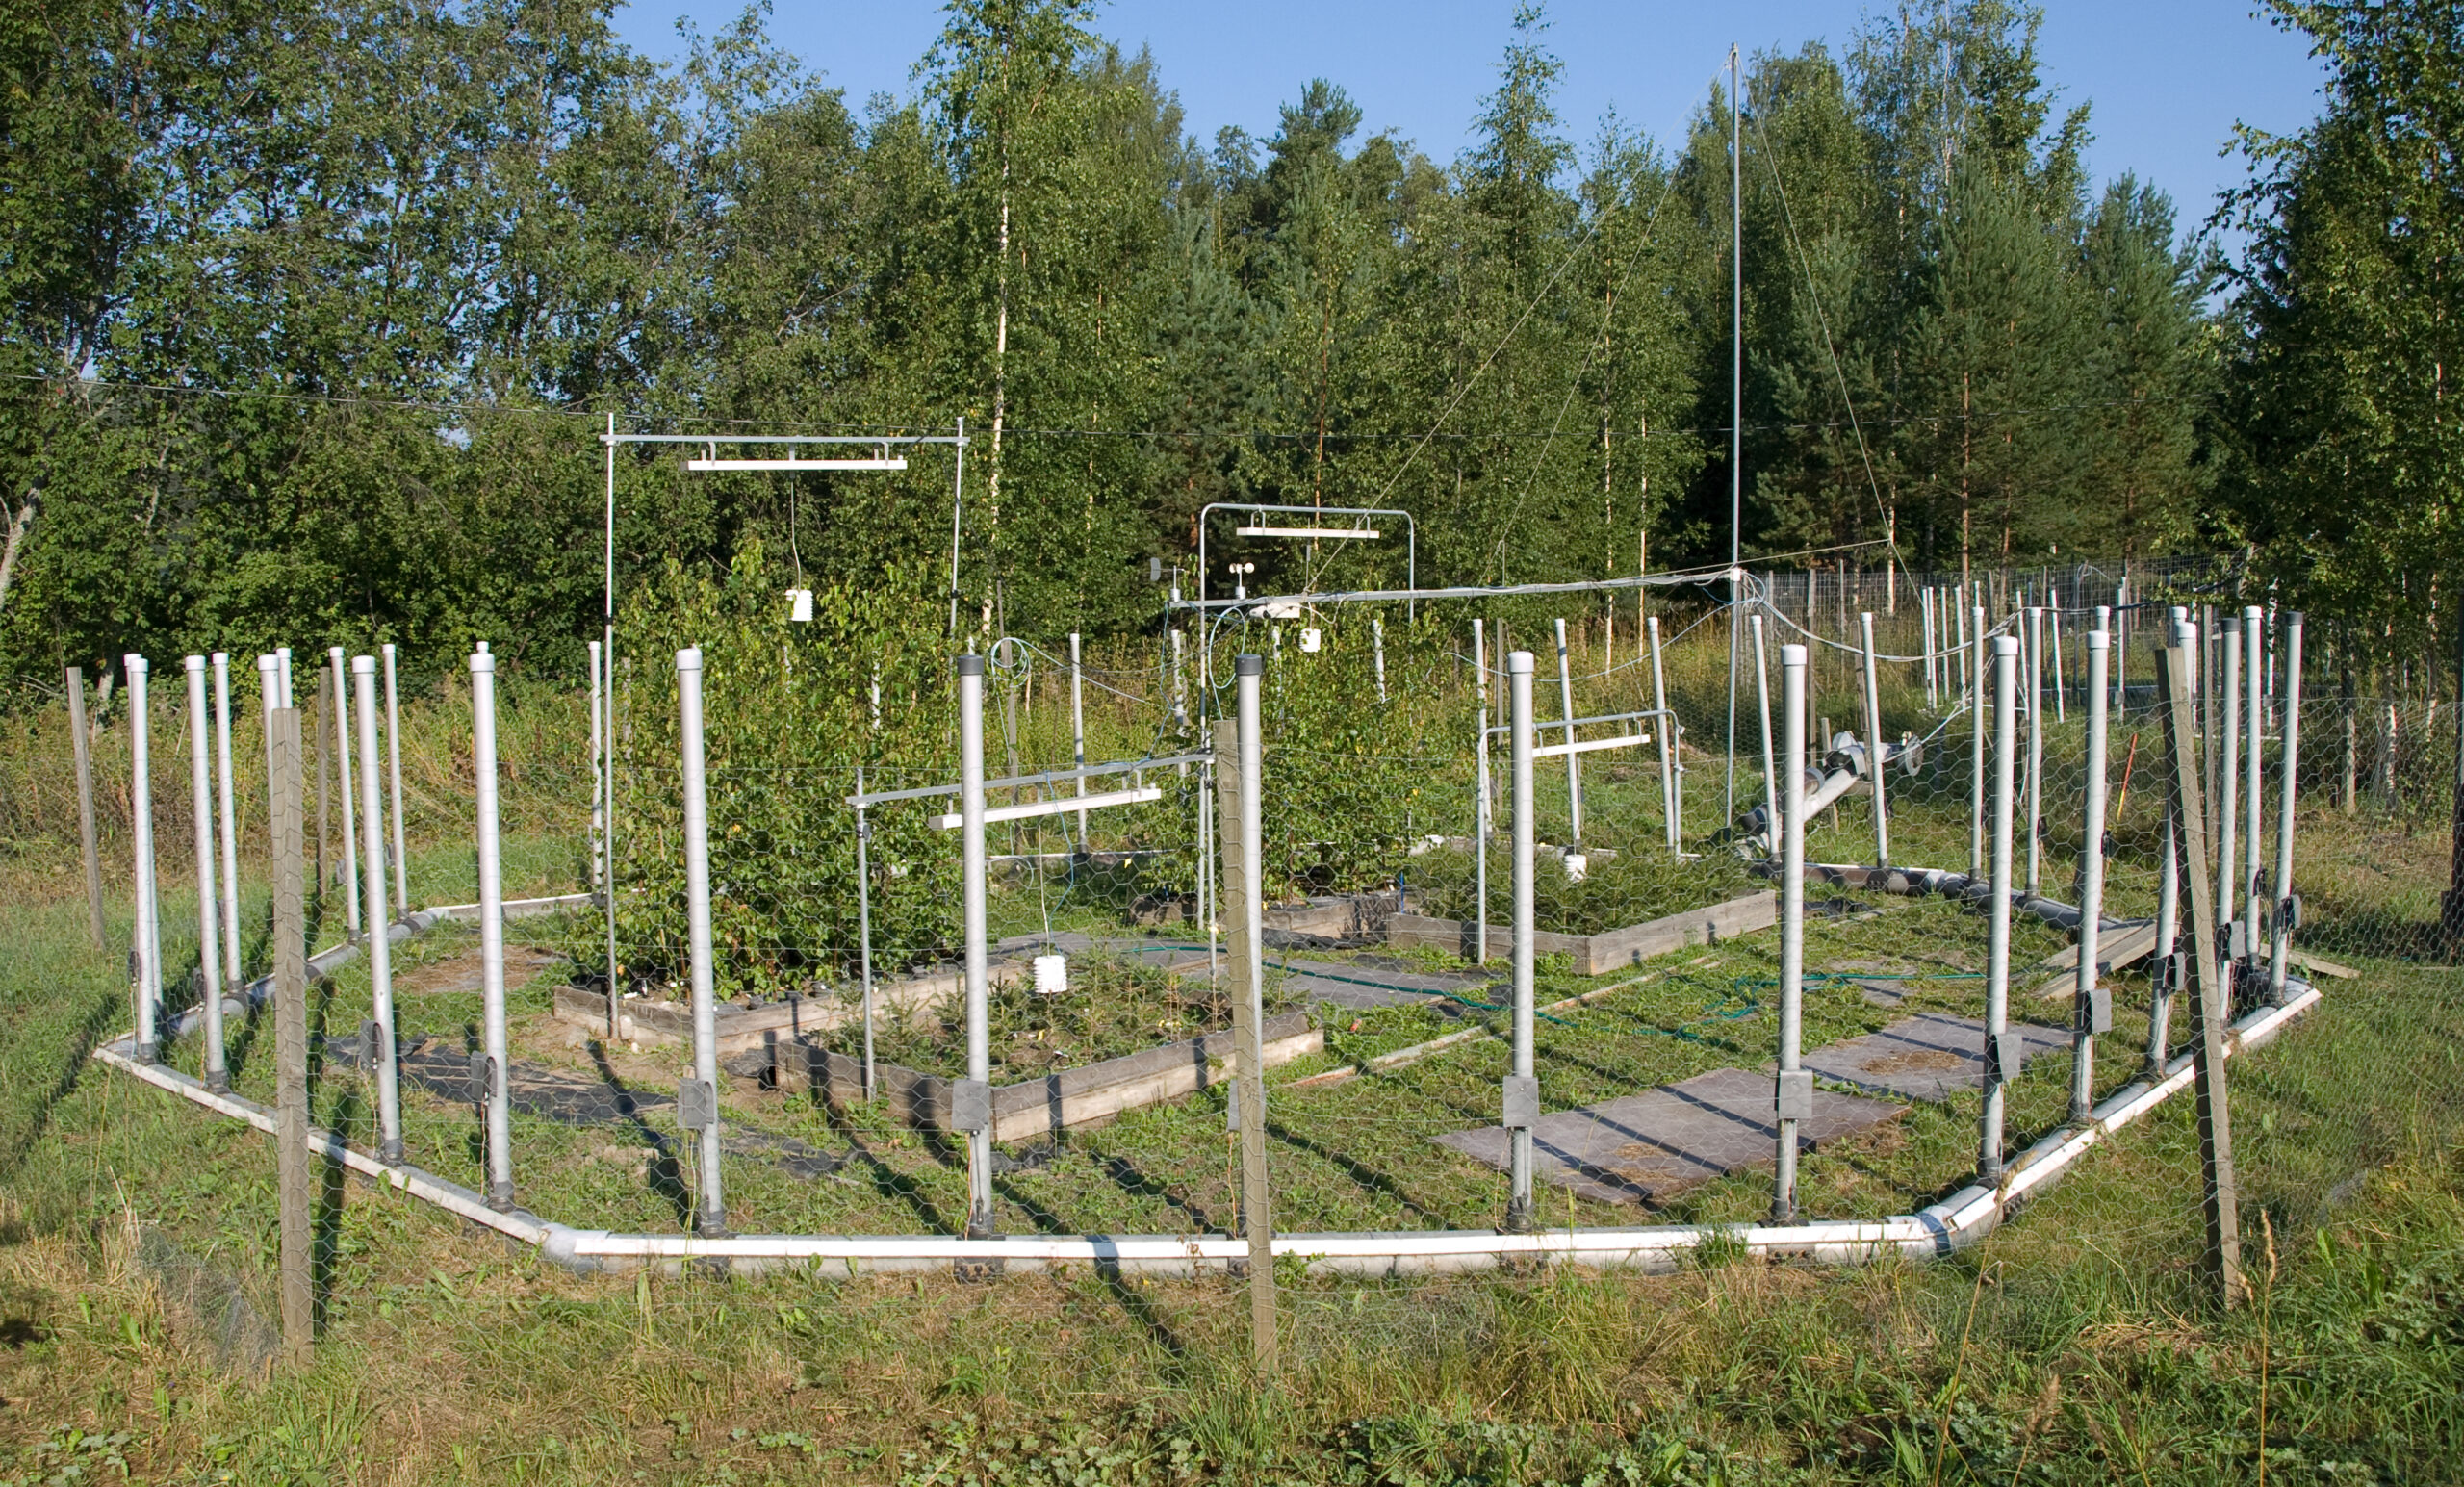
– Site selection: Plots were established at a specific field to represent both genotypes accurately.
– Instrument installation and computer setup: To monitor the site efficiently, air, soil, and ozone sensors in each plot were wired to a central computer in a field cabin, where data loggers recorded and transmitted all readings continuously.
– Calibration: Regular checks ensured sensor accuracy, a critical step for valid results.
– Data collection: Automated loggers recorded measurements continuously; manual verification confirmed reliability.
– Maintenance: Sensors were cleaned and batteries checked to prevent data gaps.
– Data storage and organization: Readings were transferred to software for analysis.
– Analysis: I tracked trends in growth, leaf area, and soil CO₂ flux.
– Reporting: Data were summarized to evaluate the impact of warming and ozone treatments.
Following this workflow ensures consistent, high-quality data over long-term studies.
Data Analysis and Interpretation
Collecting data is only the first step. Analysis and interpretation allow meaningful conclusions:
Trend identification: Detect changes in growth, leaf area, or soil respiration over time.
Comparisons: Evaluate treatment effects versus controls.
Genotype-specific responses: Identify differences between tree genotypes under the same conditions.
Predictive modeling: Forecast ecosystem responses under future scenarios.
Using repeated measurements, I found that temperature enhanced soil respiration more in gt15 than gt14, demonstrating that genetic differences influence responses to environmental stressors.
Common Challenges
Environmental monitoring can face practical issues:
Equipment failure: Sensors must be regularly calibrated.
Weather effects: Rain, wind, or extreme temperature can influence readings.
Complex interactions: Multiple variables, such as temperature, ozone, and genotype, require careful design and analysis.
Data gaps: Missing or erroneous data can affect trend detection.
In my fieldwork, I mitigated these challenges by frequent checks, backup instruments, and structured data protocols.
Why Proper Tools and Methods Matter
Without accurate tools, monitoring can produce misleading or incomplete results.
My research showed that:
Subtle growth differences between genotypes would have been missed without vernier calipers.
Soil CO₂ flux variations required continuous monitoring with flux chambers.
Ozone impacts were only clear because of controlled exposure systems, wired sensors, and repeated air measurements.
Proper EMS and methodical fieldwork ensure data reliability, allowing conclusions about environmental stressors and ecosystem responses.
Conclusion
Environmental monitoring systems combine technology, field tools, and structured methods to collect reliable data.
My silver birch study demonstrates that:
Accurate sensors and calibrated instruments are essential for detecting subtle ecological changes.
EMS enables long-term, continuous monitoring of air, soil, and plant responses.
Digital data management allows trend analysis, treatment comparisons, and predictive modeling.
Hands-on tools like calipers, leaf scanners, and flux chambers are necessary to capture fine-scale biological responses.
Modern EMS and computers allow researchers to observe, analyze, and predict environmental changes at scales previously impossible, improving both research accuracy and environmental management.
FAQs
What is an environmental monitoring system (EMS)?
A system of sensors, data loggers, and software that continuously measures and records environmental conditions.
What are common environmental monitoring tools?
Includes gas analyzers, flux chambers, soil probes, leaf scanners, and calipers. Each measures specific air, soil, or biological variables.
How do computers help in environmental monitoring?
They store large datasets, detect trends, compare treatments, and model ecosystem responses.
How is environmental monitoring performed in the field?
Steps include site selection, sensor installation, wiring to computers, calibration, continuous measurement, data storage, analysis, and reporting.
Why is calibration important?
Ensures sensors provide accurate, reliable data, critical for long-term studies.
How does environmental monitoring support ecosystem management?
It detects early changes, measures treatment effects, and informs decisions like selecting resilient genotypes or predicting carbon flux changes.