

Many people want to know if our forests are healthy. We often hear that trees help the planet by taking in carbon dioxide (CO2). Carbon dioxide is a gas that can make the planet warmer. Trees use this gas to grow.
But how do scientists measure this?
How do we know how much gas is moving between the trees, the soil, and the sky?
Measuring how this gas moves is called carbon flux. It is very important for scientists today. They use tall towers, small tools on the ground, and computers to calculate it.
In this guide, I will explain exactly how we measure carbon flux. I will use my own experience from my research and studies to show you how it works.
Measuring from the Sky
When we want to understand how an entire forest exchanges carbon, we cannot focus on just one tree. We need to study the whole area. For this, scientists use a method called Eddy Covariance.

What is an “Eddy”?
To understand this, think of a river. Water does not flow in a perfectly straight line. It moves in small swirling motions. Air behaves in a similar way. These swirling motions in the air are called eddies.
As eddies move, they transport different things, such as heat, water vapor, and carbon dioxide (CO₂).
If CO₂ moves upward in these air movements, it means the forest is releasing carbon into the atmosphere.
If CO₂ moves downward toward the forest, it means the forest is taking in carbon from the air.
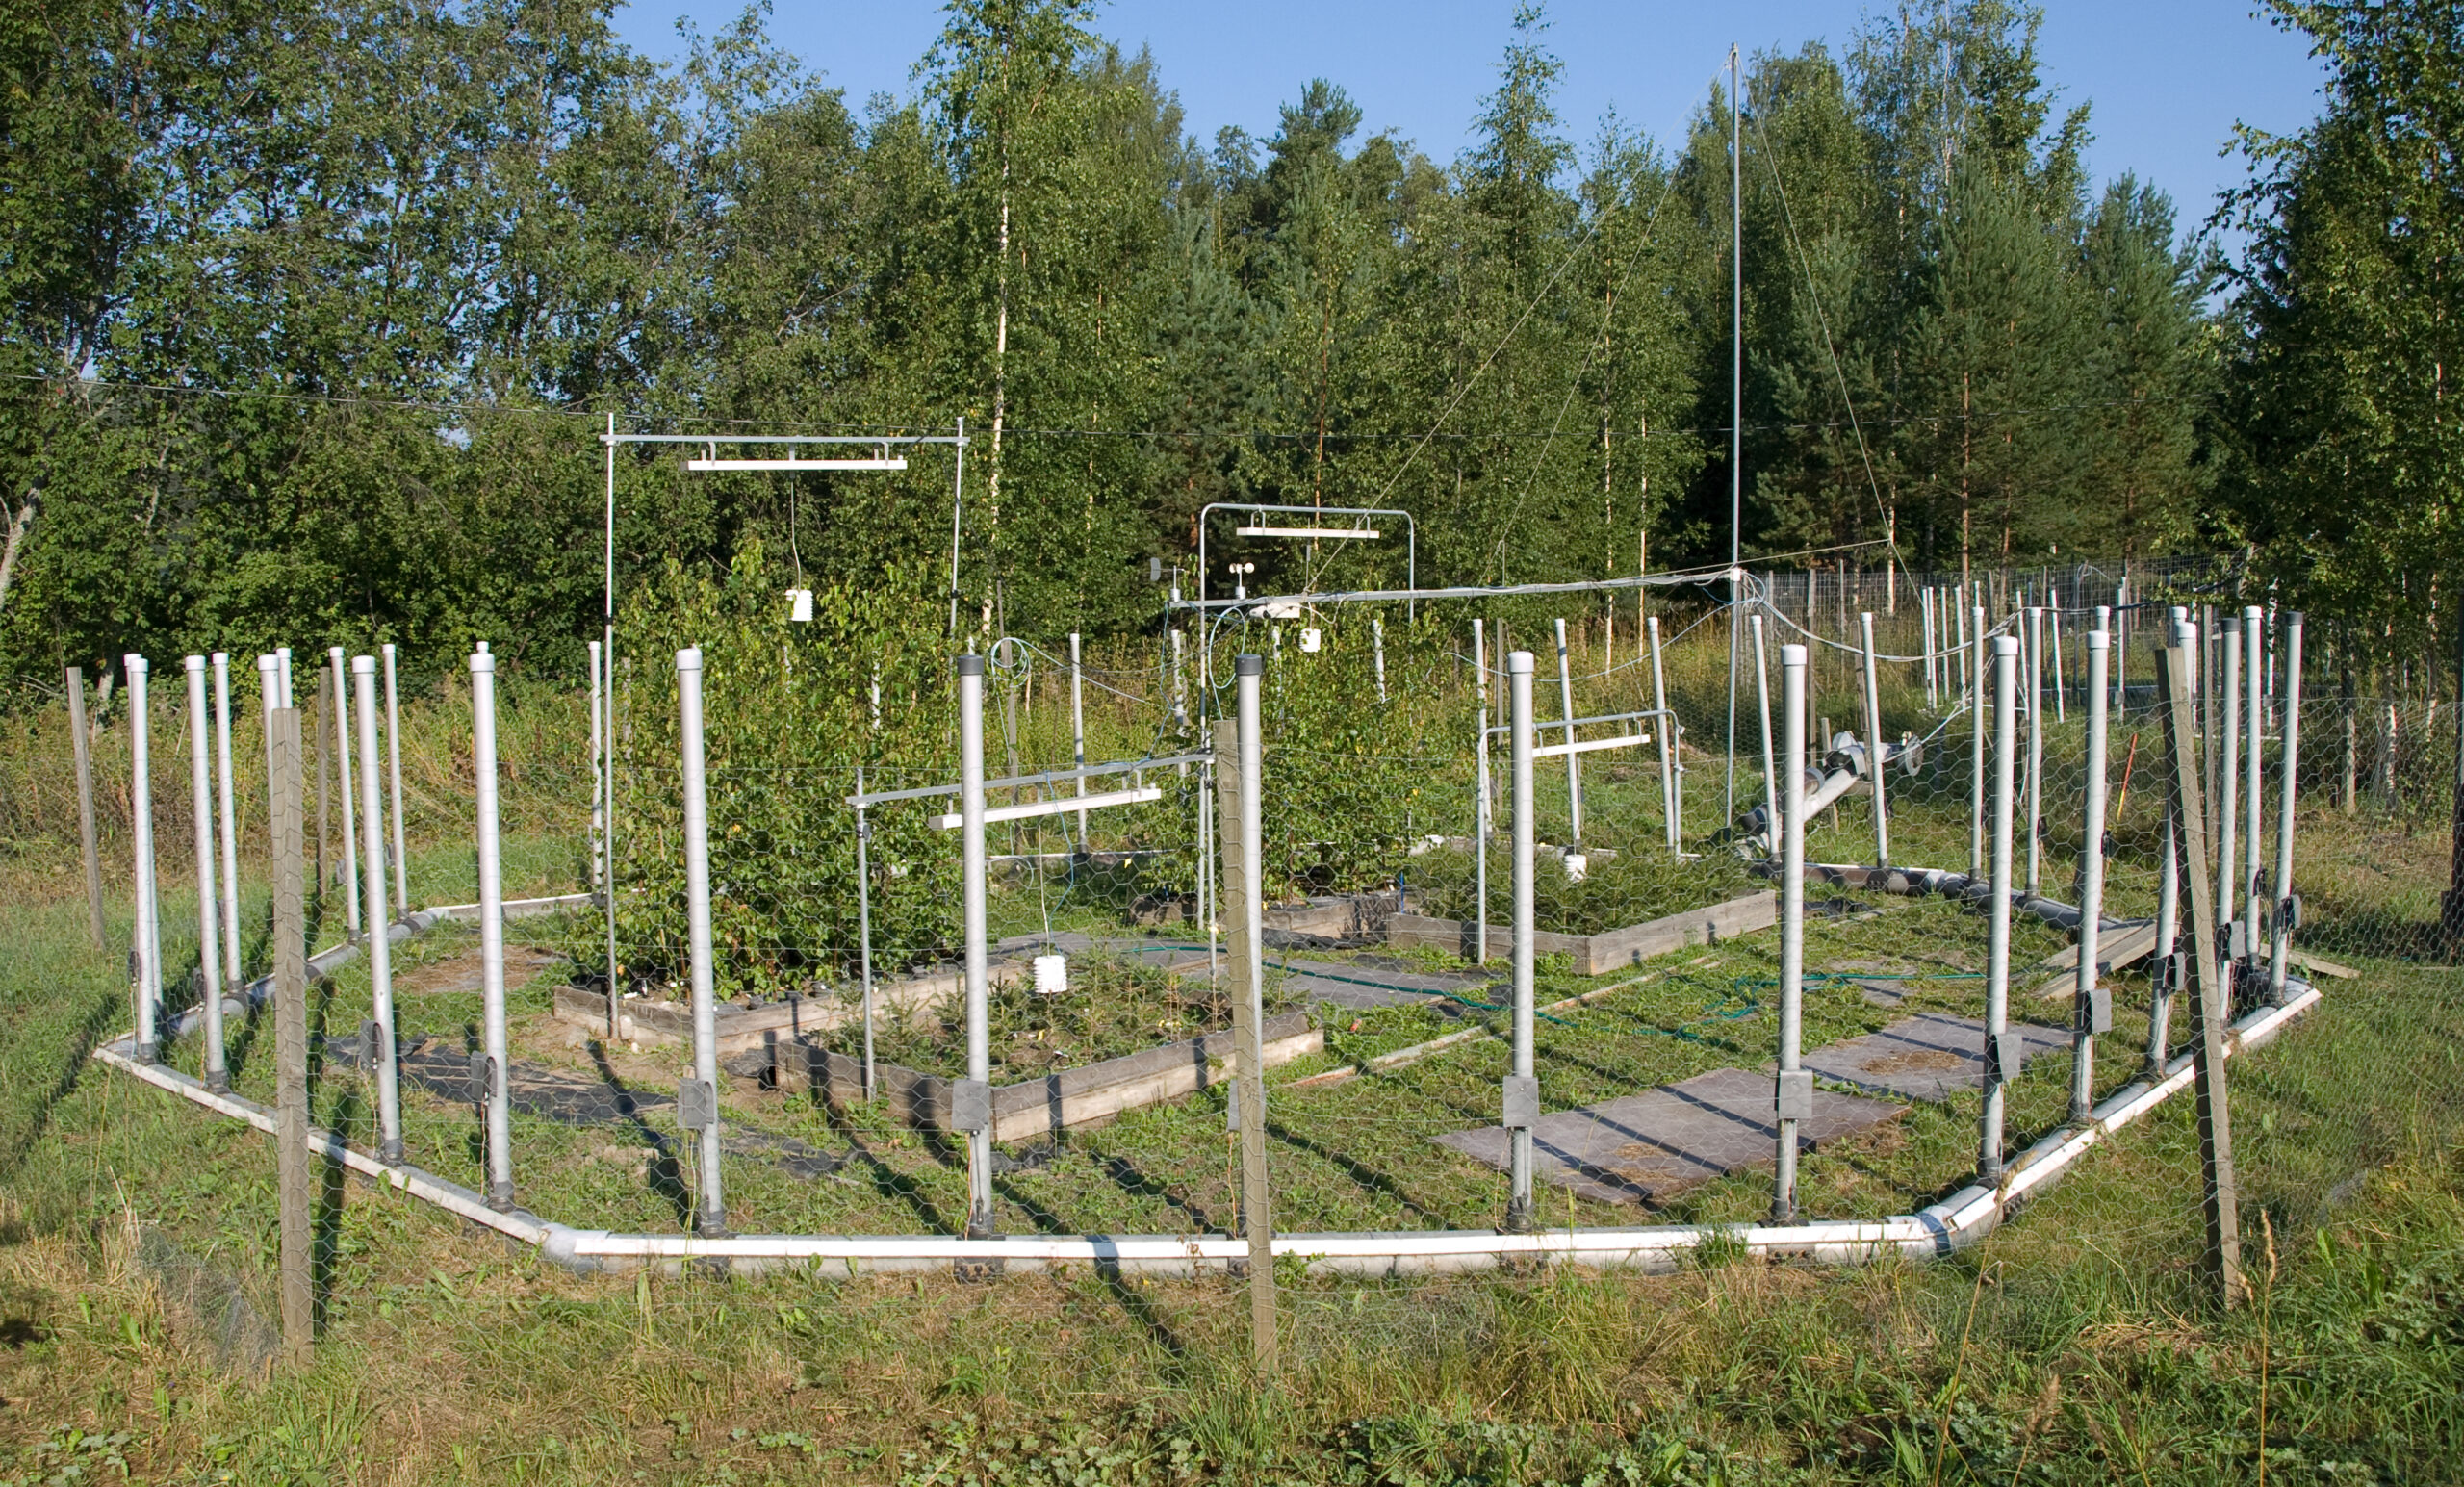
The Tools on the Tower
To measure these fast air movements, scientists build a tall tower that rises above the trees. On top of the tower, two main instruments are used:
3D Sonic Anemometer:
This measures wind speed in three directions (up-down, left-right, and front-back). It has no moving parts. Instead, it uses sound waves to detect wind movement very quickly, 10 to 20 times per second.
Infrared Gas Analyzer (IRGA):
This device measures the amount of CO₂ in the air. It sends out infrared light, and because CO₂ absorbs this light, the instrument can calculate how much CO₂ is present. It also collects data around 20 times per second.
How the Result is Calculated
By measuring wind movement and CO₂ concentration at the same time, scientists calculate Net Ecosystem Exchange (NEE).
If upward air movement carries more CO₂, the area is releasing carbon.
If downward movement brings CO₂ into the forest, the area is absorbing carbon.
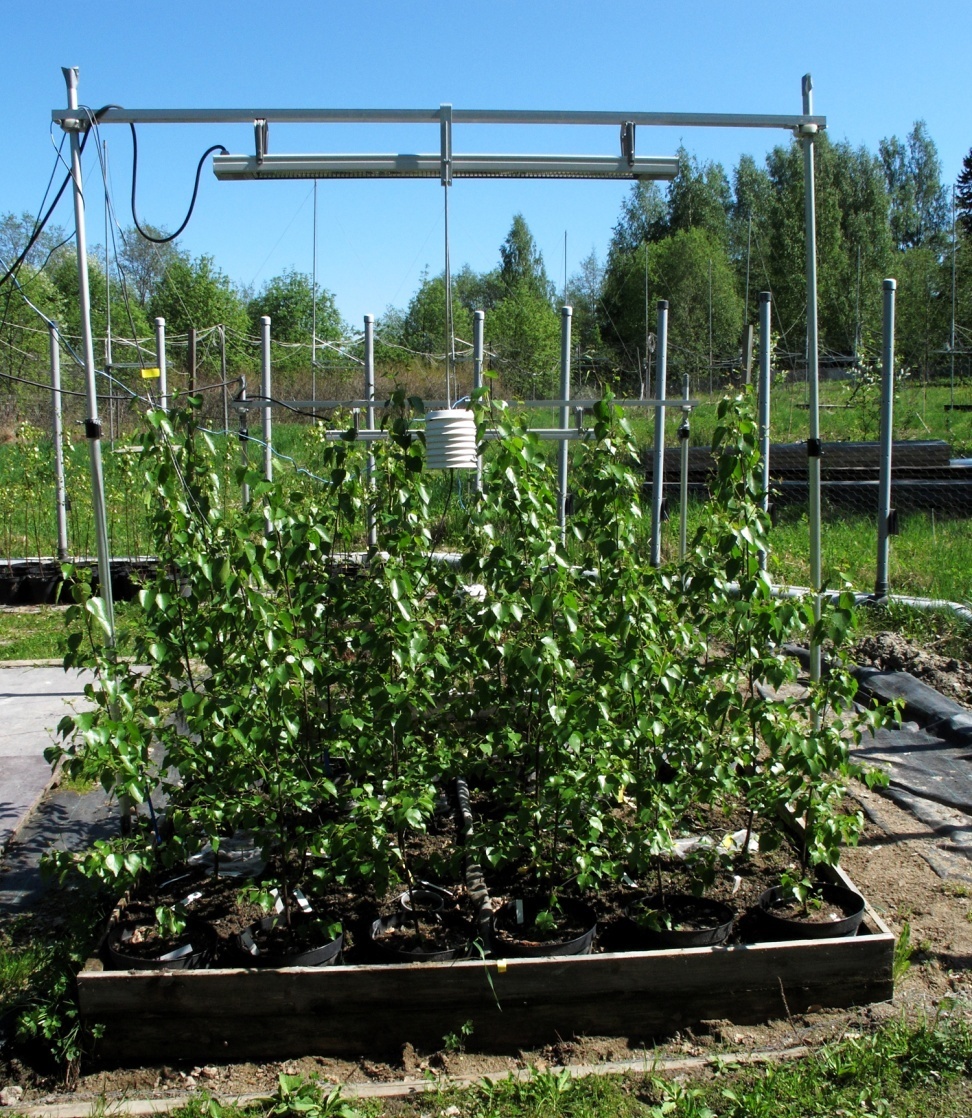
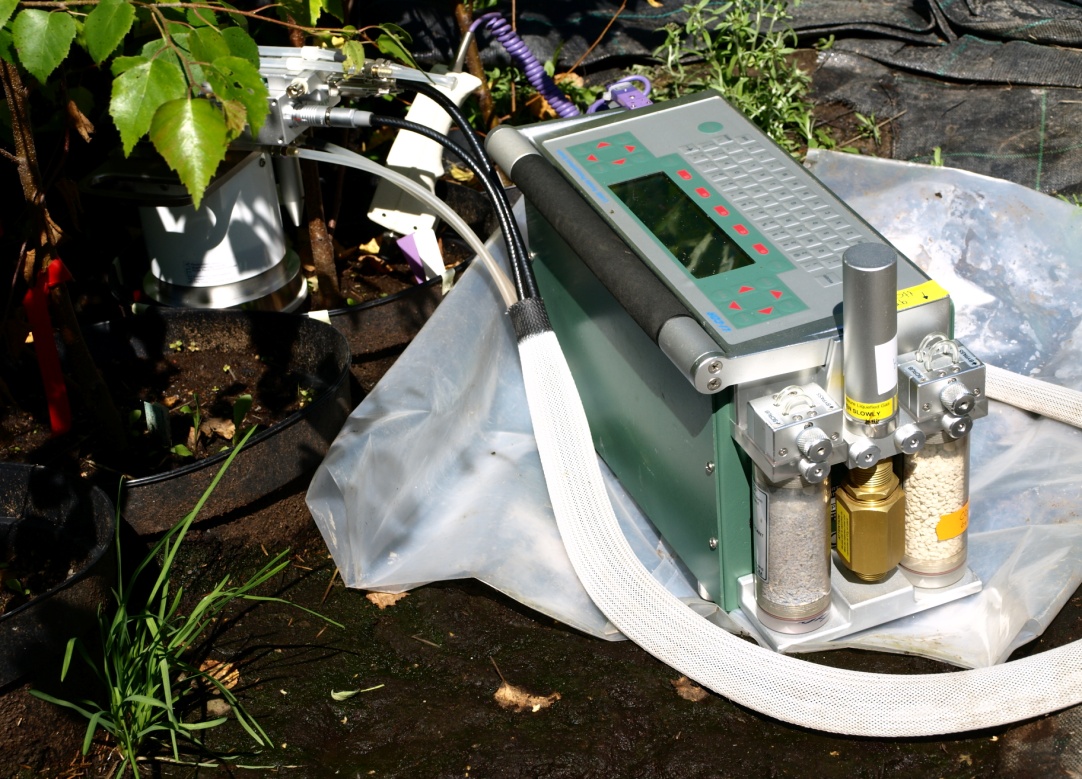
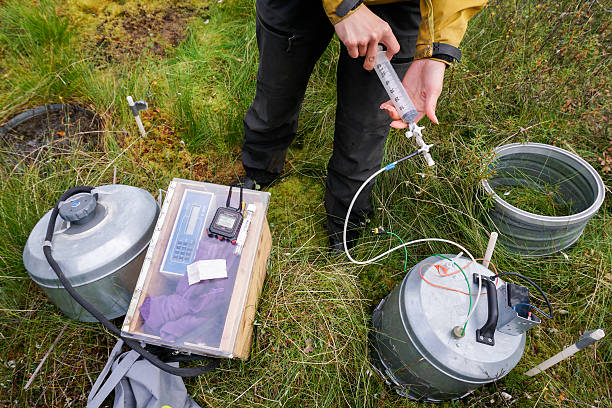
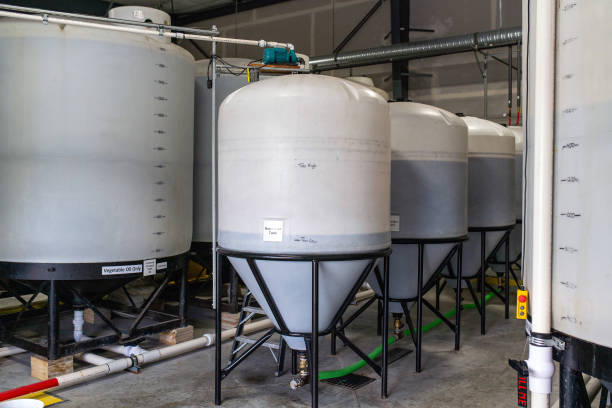
What Happens in the Soil?
The tower gives us a “top-down” view of the whole forest, but to fully understand carbon exchange, we also need a “bottom-up” view. This means looking at what is happening in the soil. This process is called soil respiration.
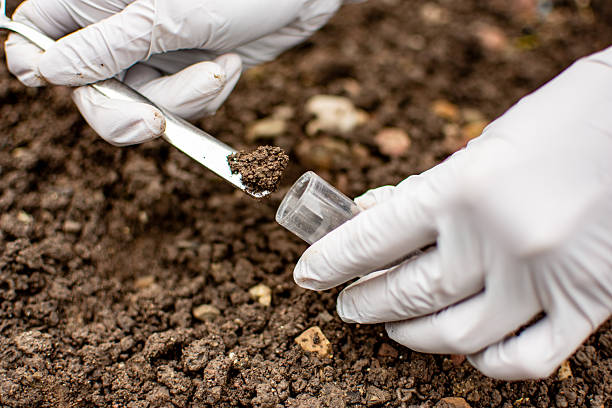
Soil respiration is the carbon dioxide (CO₂) released from tree roots and the tiny organisms (microbes) living in the soil.
In my own research, I also measured soil respiration directly in the field using a LI-COR 6400 soil chamber. This helped me understand how warming and ozone affect silver birch, and how these factors influence soil carbon release.

This work helped show how soil processes contribute to the overall carbon balance of the ecosystem, together with the tower measurements.
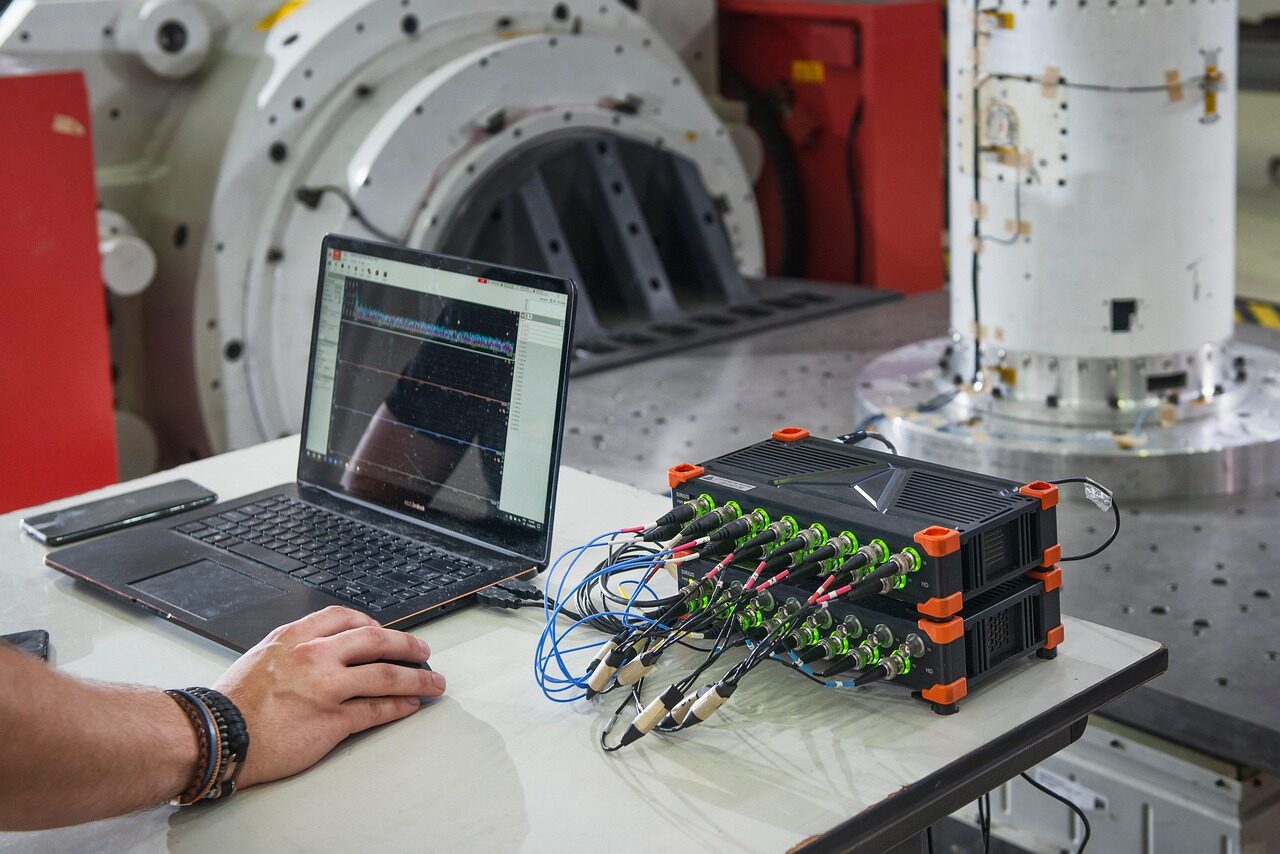
Processing the Data
After the fieldwork is done, we don’t have a simple answer yet. Instead, we have a computer folder full of Excel files. These files are complex. They have large datasets with many rows of measurements. To turn these numbers into meaningful results, we use a special computer tool called REddyProc. This tool was developed by scientists at the Max Planck Institute.
Step 1: Cleaning the Data
Not all data is good data. Sometimes it rains, and the water gets on the sensors. Sometimes the wind is too still. At night, if there is no wind, the CO2 just sits on the ground and doesn’t reach the tower. We call this the U-Star problem. We use a test called the Moving Point Test to find these bad times and remove them. We only want to keep the “clean” data.
Step 2: Filling the Gaps
What happens if the power goes out or a sensor breaks? We might lose 5 hours of data. We cannot just leave a hole in our report. We use a method called Marginal Distribution Sampling (MDS). The computer looks at the weather we recorded (like sunlight and temperature) and “predicts” what the carbon flux was based on other days with the same weather. This gives us a full, 24-hour story.
Step 3: Splitting the Data (Partitioning)
This is the most important part of my work. The tower only tells us the “Net” total. But the forest is doing two things at once: it is eating CO2 and breathing out CO2. We want to know the difference.
-
GPP (Gross Primary Production): This is the total amount of carbon the trees “eat” through photosynthesis.
-
Respiration: This is the total amount of carbon the whole forest (trees and soil) “breathes out.”
We use a special math rule (the Reichstein method) to split these apart. By doing this, we can prove exactly how much a forest is helping the air versus how much it is releasing.
Why This Matters for the Real World
You might think this is only for people working in laboratories, but it is actually useful for everyone. We do this work to understand what is really happening in the environment.
Today, many companies say they are “carbon neutral” or “green.” But how do we know if that is true? Scientists use towers and soil measurements to check the real data. For example, if a company plants a forest, these tools can show whether that forest is really taking carbon out of the air.
I personally believe in this kind of real science. Understanding the carbon cycle helps us in many ways. It helps us grow better food, choose the right trees to plant, and take better care of our planet for the future.
Science is about understanding the Earth. Whether we use a tall tower or a small soil ring, we are learning how nature works and how to protect it.
You can find the official tool here: Access the REddyProc Tool (MPI Jena)
FAQs
What exactly is Eddy Covariance?
It is a way to measure how gas moves. It uses the wind (the eddies) to see if CO2 is moving up or down.
What do the towers measure?
They measure three main things: wind speed, gas levels (CO2 and water), and heat. This tells us the total carbon balance of the forest.
Does wet soil always release more gas?
Not always. If the soil is like a desert, it releases very little. If it is like a swimming pool (flooded), it also releases very little because the microbes cannot breathe without oxygen. It needs to be “just right.”
What happens if it rains on the tower?
Rain is tricky. It can make the gas sensor “blind” for a moment. This is why we use special computer cleaning to remove the “spikes” in the data caused by the rain.