


Can burning a crop really count as zero emissions? And if so, who decides?
Those questions sit at the heart of every biofuel policy debate, every carbon credit transaction, and every sustainable aviation fuel contract being signed right now. The answer depends heavily on one tool: the GREET model.
If you work in bioenergy, renewable fuels, agriculture, or environmental research, you need to understand what GREET is, how it works, and why it has become the standard reference for calculating carbon intensity across the entire biofuel supply chain.
What Does GREET Stand For?
GREET stands for Greenhouse gases, Regulated Emissions, and Energy use in Technologies. It is a life cycle analysis model developed by Argonne National Laboratory and funded by the U.S. Department of Energy’s Bioenergy Technologies Office.
The model has been in continuous development since the mid-1990s and has grown into one of the most widely used analytical tools in energy and environmental research. It currently has over 40,000 registered users worldwide, spanning government agencies, universities, industry, and independent researchers.
That scale of adoption tells you something important. GREET is not just an academic exercise. It directly influences policy, tax credits, regulatory compliance, and investment decisions across the global bioenergy sector.
What Does the GREET Model Actually Do?
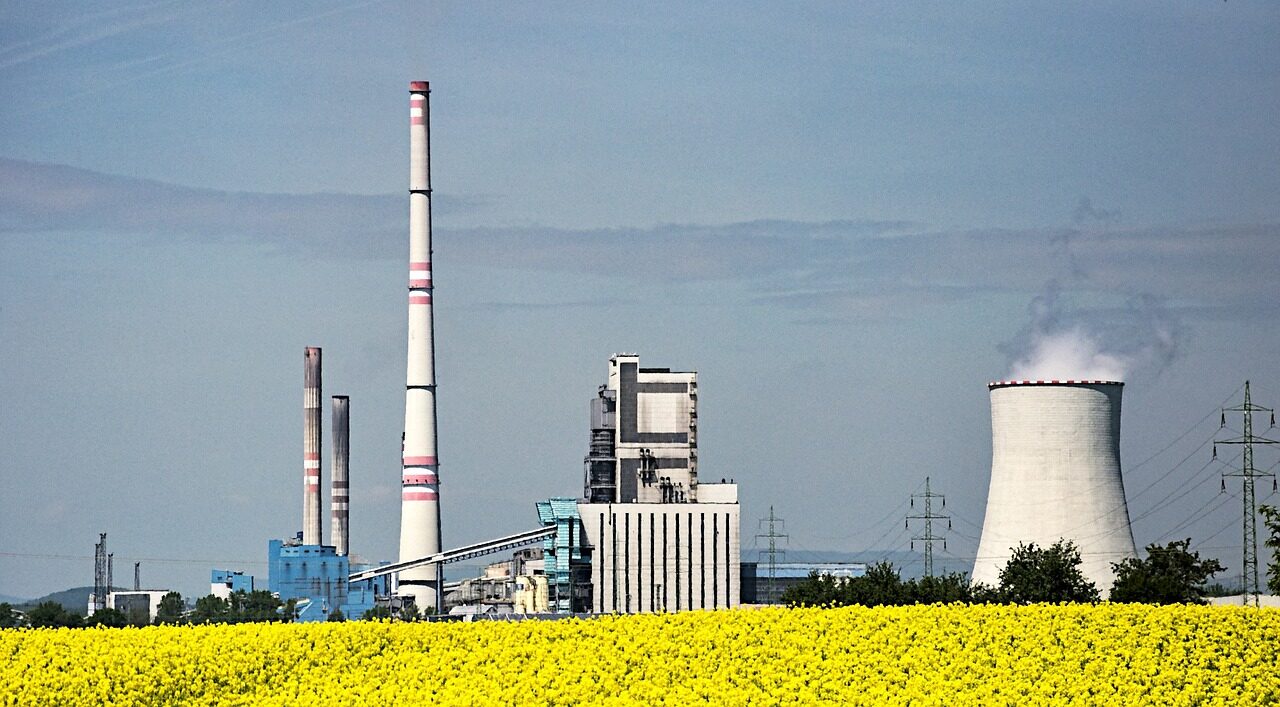
At its core, GREET calculates the full lifecycle greenhouse gas emissions of a fuel or energy pathway, from the moment a feedstock is grown or extracted all the way through to the final combustion of the fuel in a vehicle or power plant.
This approach is called well-to-wheels analysis, or sometimes farm-to-fumes in the context of agricultural biofuels. It accounts for every stage: growing the feedstock, transporting it, converting it into fuel, distributing that fuel, and burning it.
The result is a carbon intensity score, typically expressed as grams of CO₂ equivalent per megajoule of energy produced (gCO₂e/MJ). A lower score means a cleaner fuel. A higher score means more emissions per unit of energy across the whole chain.
This is where GREET gets interesting for researchers and farmers alike. Two fuels that look identical at the point of combustion can have very different carbon intensity scores once you account for how the feedstock was grown, what land was used, how the conversion process was powered, and how far the fuel travelled before it was burned.
Why Does Carbon Intensity Actually Matter?
Carbon intensity scores are no longer just academic metrics. They now directly determine financial outcomes for fuel producers.
The U.S. Inflation Reduction Act introduced the Section 45Z Clean Fuel Production Credit, which rewards renewable fuel producers for achieving lower carbon intensity scores. The lower your CI score, the larger the tax credit your fuel qualifies for. GREET is the model specified under U.S. federal policy for calculating those scores.
California’s Low Carbon Fuel Standard operates on the same principle. Fuel producers earn credits for every unit of fuel they sell that comes in below the carbon intensity benchmark. Those credits have real market value. GREET underpins the calculation of those benchmarks.
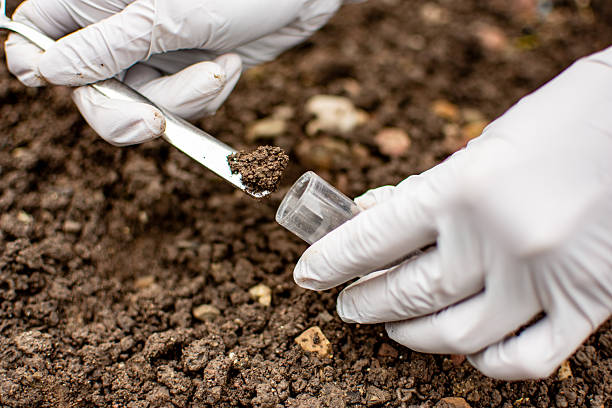
For farmers supplying biofuel feedstocks, this creates a direct financial incentive to adopt practices that lower their carbon intensity contribution. Cover crops, no-till farming, manure application, and improved fertiliser management all affect the carbon intensity score of the grain or biomass they supply. GREET now allows users to model these effects at a county level, which means a farmer can see exactly how a change in land management translates into a different CI score for the fuel produced from their crop.
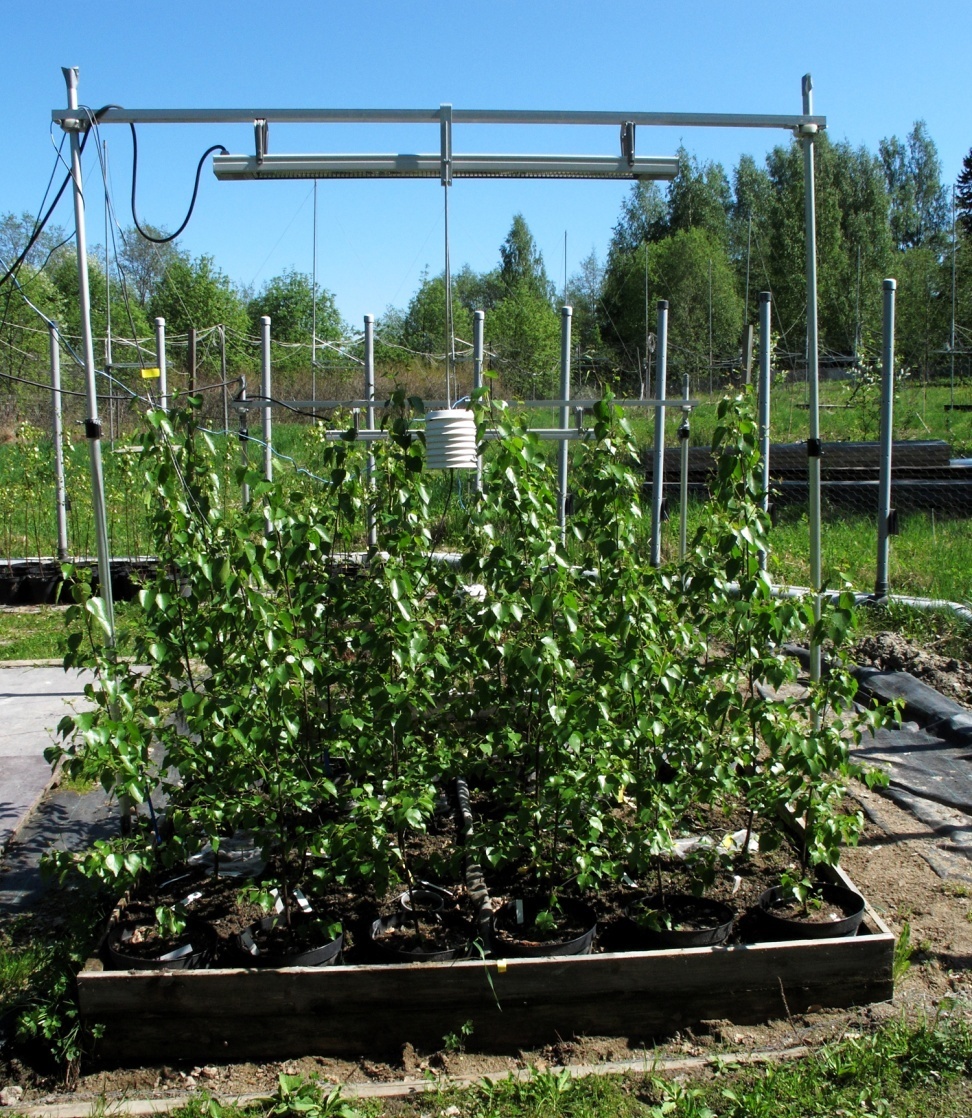
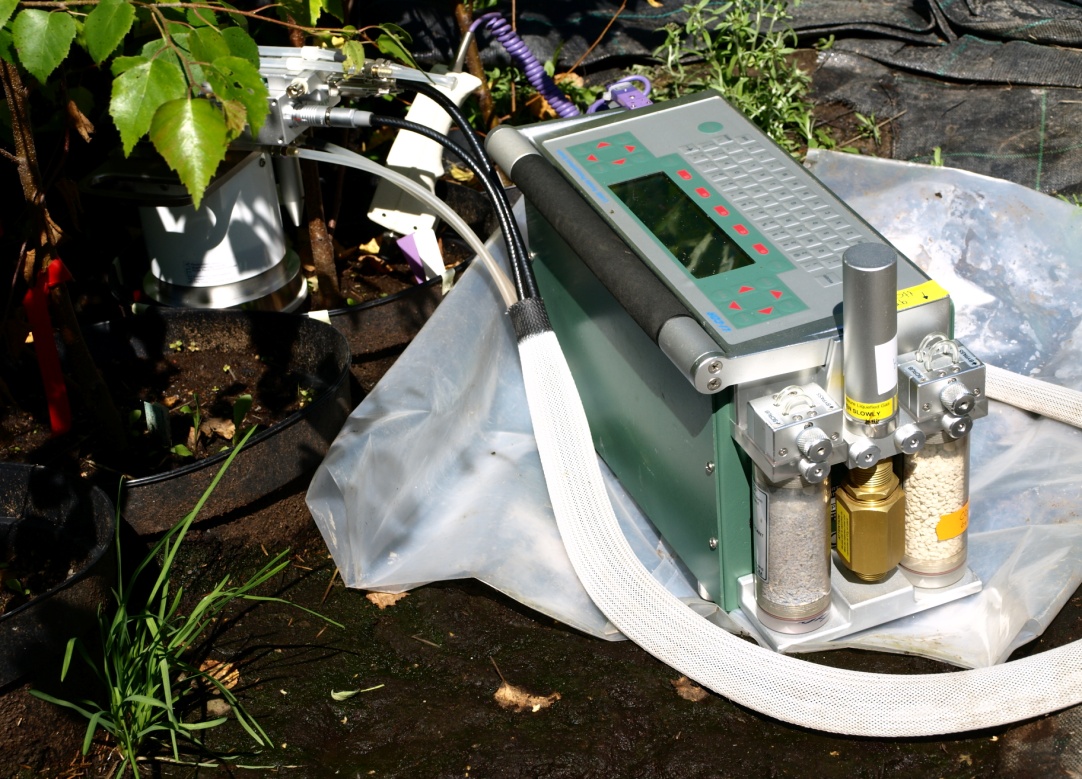
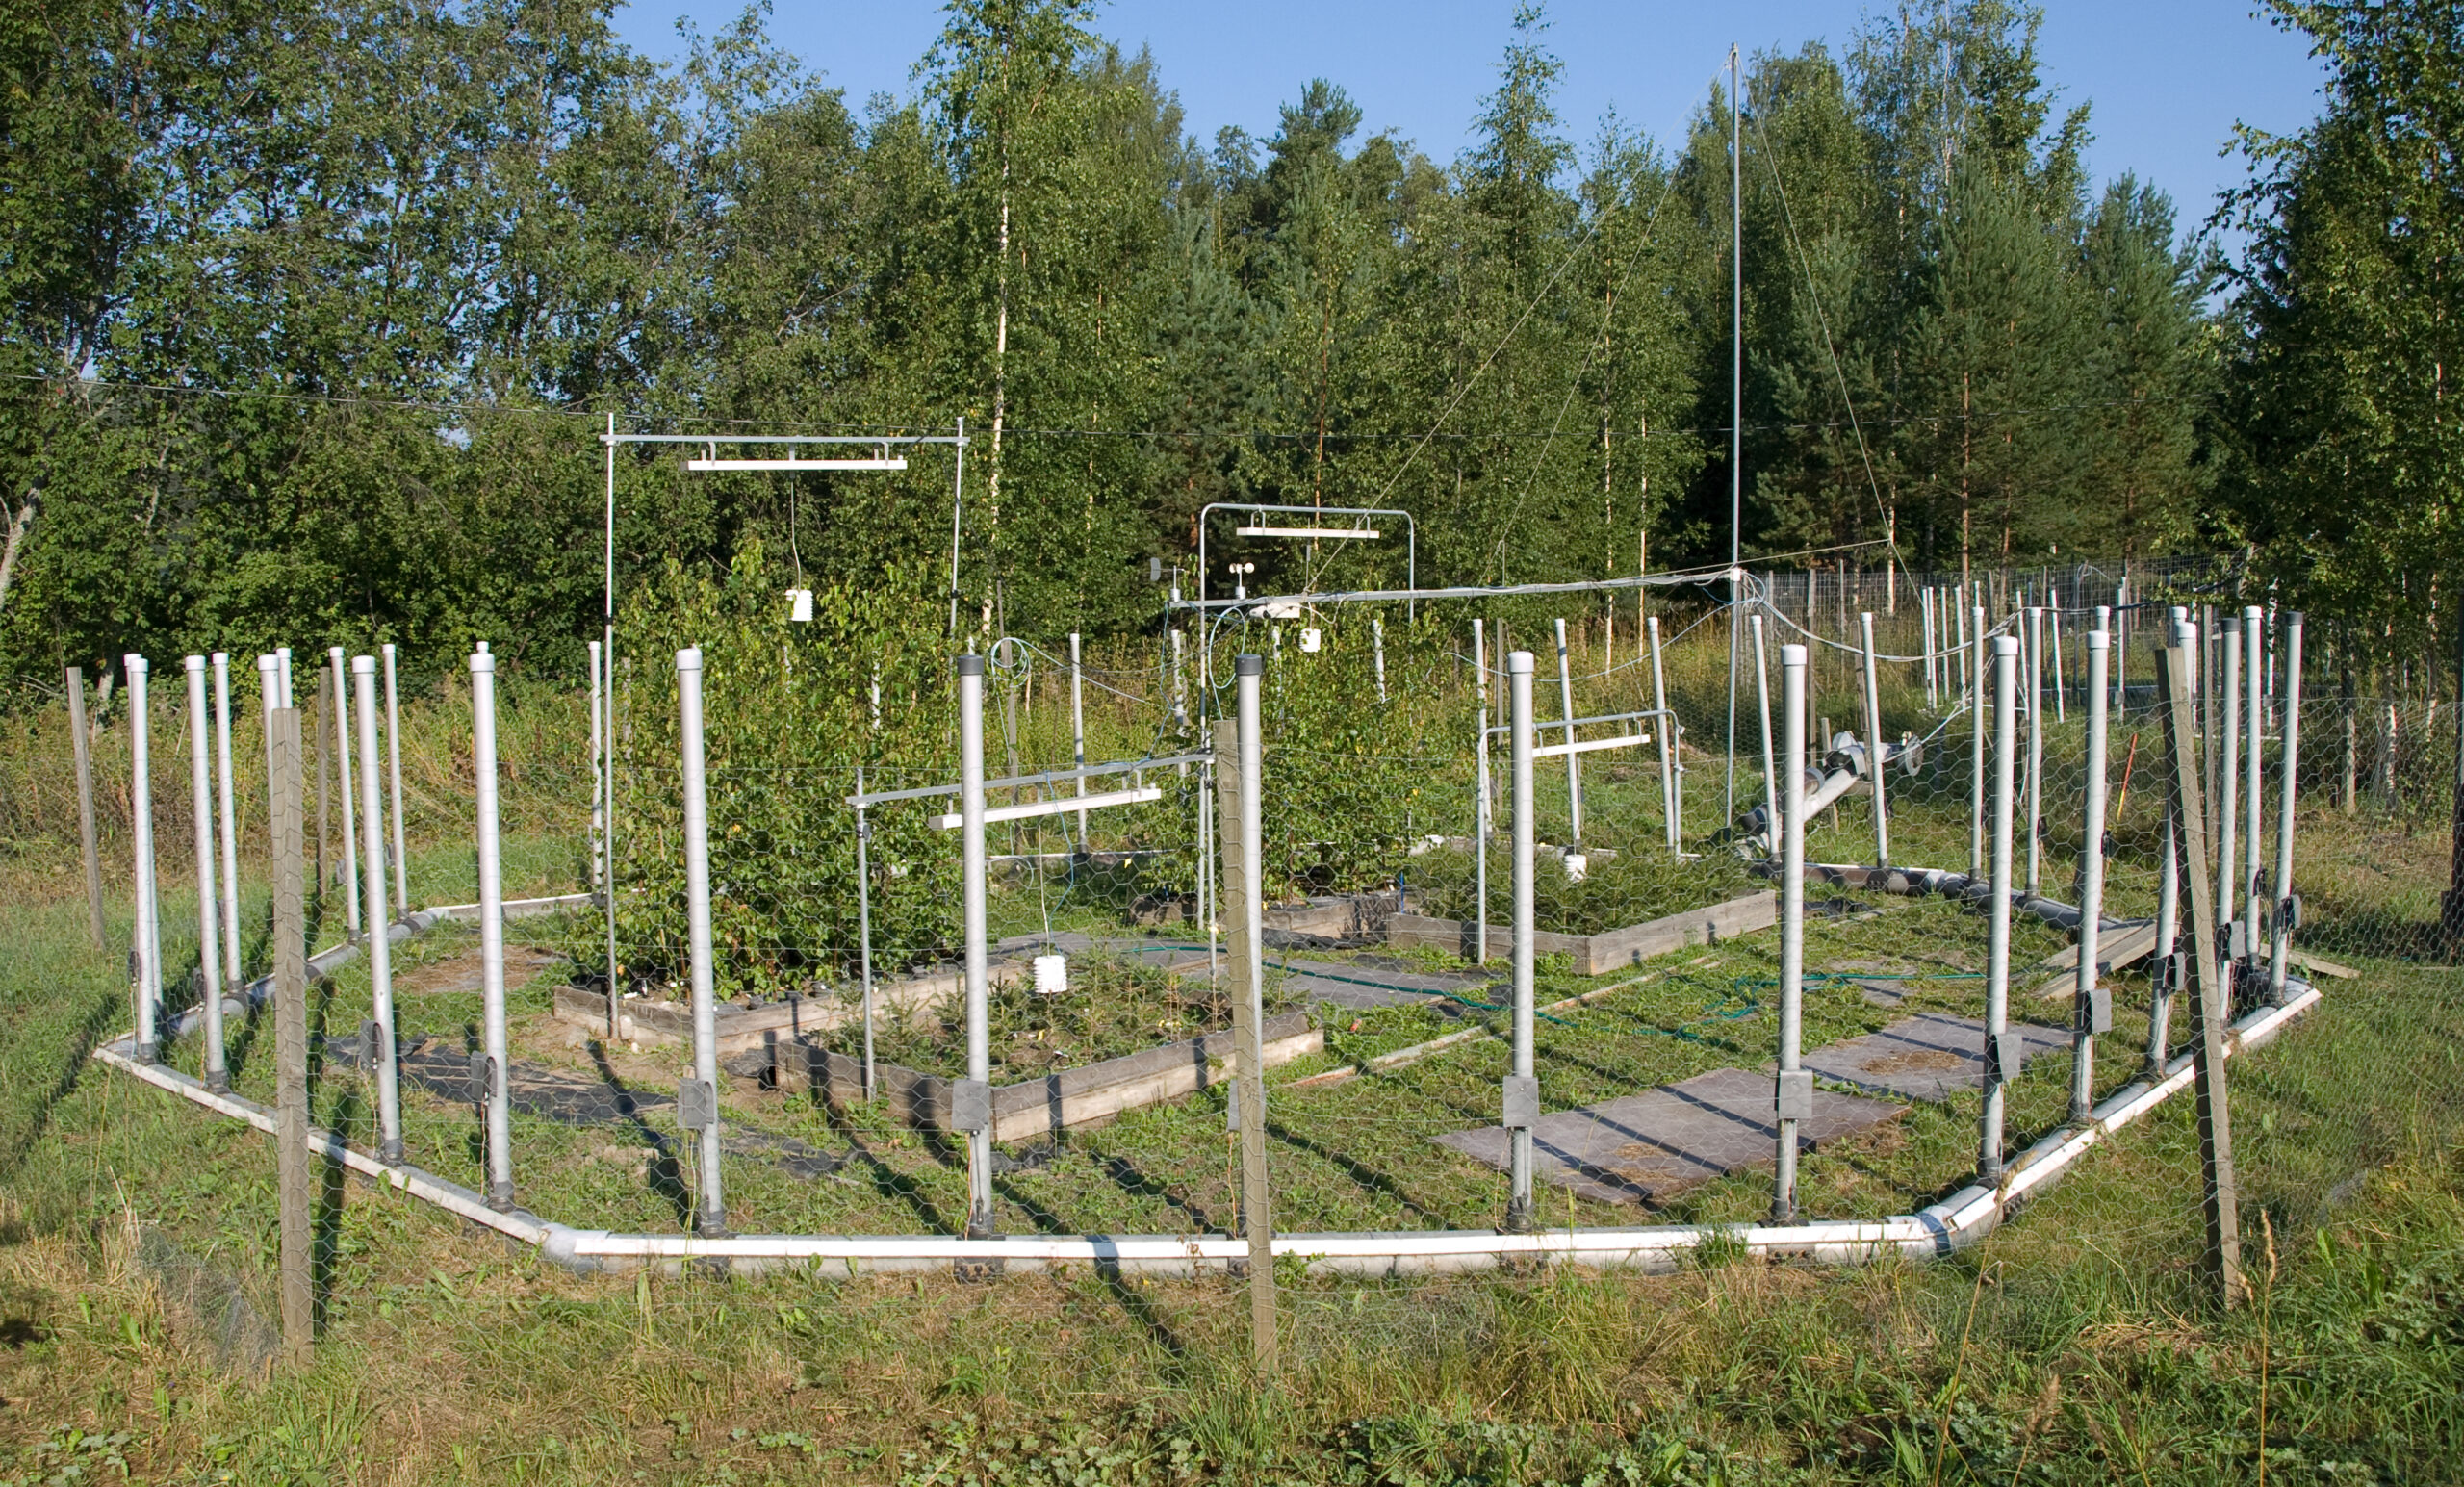
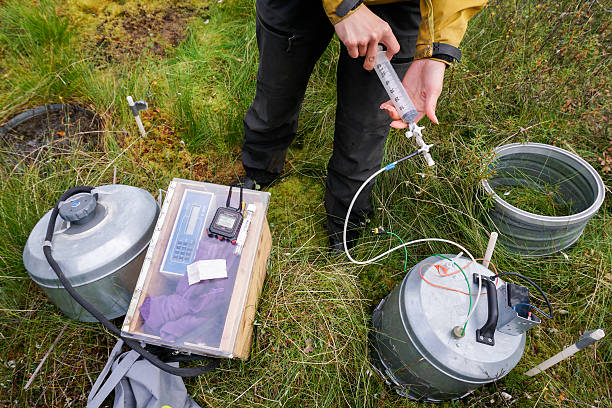
This connection between farm-level soil carbon management and biofuel carbon intensity is something I find particularly relevant given my own research background. In my field experiment measuring soil CO₂ efflux under different management conditions, I saw directly how land management choices alter soil carbon dynamics. GREET essentially scales that kind of thinking up to a policy level, translating field-level carbon fluxes into fuel lifecycle scores.
What Fuel Pathways Does GREET Cover?
GREET covers an extensive and growing range of fuel production pathways. The main categories include:
Corn ethanol, which remains the most widely modelled pathway given its dominance in U.S. biofuel production. GREET models different production methods, feedstocks, and process energy sources so producers can identify which combination achieves the best carbon intensity outcome.
Cellulosic biofuels from feedstocks like switchgrass, forest residues, poplar, and corn stover. These pathways generally achieve lower carbon intensity scores than grain-based fuels but involve more complex conversion processes.
Sustainable aviation fuel, which has become one of the fastest-growing areas of GREET application as airlines and governments push hard to decarbonise commercial flight. GREET is used to verify SAF carbon intensity for both the U.S. and international compliance frameworks.
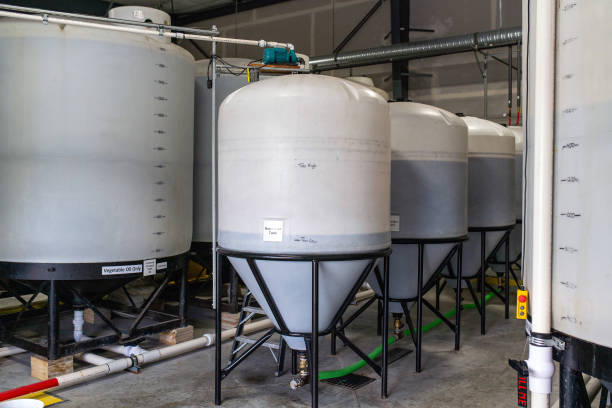
Biodiesel and renewable diesel from vegetable oils and animal fats. Hydrogen production pathways from biomass, electrolysis, and steam methane reforming. Biogas and biomethane from anaerobic digestion of agricultural and municipal waste.
The model is updated regularly by the Argonne team to incorporate new research, new feedstock data, and new production routes as the bioenergy sector evolves.
How Is GREET Used in Practice?
GREET is available as a free download from Argonne National Laboratory in two main forms. The standard R&D GREET runs as an Excel-based tool, which makes it accessible to a wide range of users without specialist software requirements. The regulatory versions, including 45ZCF-GREET for the Clean Fuel Production Credit and 45VH2-GREET for hydrogen, are tailored specifically for compliance calculations under U.S. tax law.
A researcher or analyst using GREET would typically start by selecting a fuel pathway and then adjust the input parameters to reflect their specific production scenario. Inputs include the type and origin of the feedstock, the energy source used in the conversion facility, transport distances, co-product handling assumptions, and land management data.
The model then calculates emissions across every stage and produces a well-to-wheels carbon intensity result. That result can be compared against regulatory benchmarks, used in environmental impact assessments, or submitted as part of a tax credit application.
One important limitation worth knowing: GREET is a modelling tool, not a measurement system. Its outputs depend on the quality of the input data and the assumptions built into each pathway. Poorly specified inputs produce unreliable outputs. This is why users with strong field-level data, including soil carbon measurements, crop yield data, and energy consumption records, tend to produce more defensible GREET analyses than those relying entirely on default values.
GREET vs Other Carbon Intensity Models
GREET is not the only life cycle analysis tool in use. CORSIA, the carbon offsetting scheme for international aviation, uses a related but different model maintained by the International Civil Aviation Organization. The two models use much of the same underlying data but diverge significantly on how they account for land use change, which can produce meaningfully different carbon intensity scores for the same fuel pathway.
California’s CA-GREET is a modified version of GREET calibrated specifically for the state’s Low Carbon Fuel Standard. It uses the same basic methodology but incorporates California-specific data and assumptions.
For European markets, the BioGrace tool and the JRC methodology under the EU Renewable Energy Directive serve similar purposes to GREET. Fuel producers operating across multiple markets often need to run analyses through several of these tools to satisfy different regulatory requirements.
FAQs
Is GREET free to use?
Yes. The R&D version and all regulatory versions are free to download from Argonne National Laboratory and the Department of Energy website. You need Microsoft Excel and a Windows operating system to run it.
Who uses the GREET model?
Government agencies, fuel producers, researchers, and farmers. The EPA used it to develop the Renewable Fuels Standard. California uses a modified version called CA-GREET for its Low Carbon Fuel Standard. It currently has over 40,000 registered users worldwide.
What is a good carbon intensity score for biofuel?
The lower the better. Under the federal 45Z tax credit, credits scale based on how far below the fossil fuel baseline your score falls. Under California’s LCFS, any score below the annual benchmark earns tradeable credits with real market value.
Can GREET model soil carbon changes from farming practices?
Yes. GREET now incorporates county-level data showing how cover cropping, reduced tillage, and manure application affect soil carbon and therefore fuel lifecycle emissions. Farm-level soil management directly changes your carbon intensity score.
How often is GREET updated?
Regularly, typically once or twice per year. The most recent regulatory releases are 45ZCF-GREET from May 2025 and 45VH2-GREET from December 2025.