


You’ve collected the data, but do you know what it’s actually telling you?
Raw data alone cannot guide decisions. To be useful, it must be trended and analyzed.
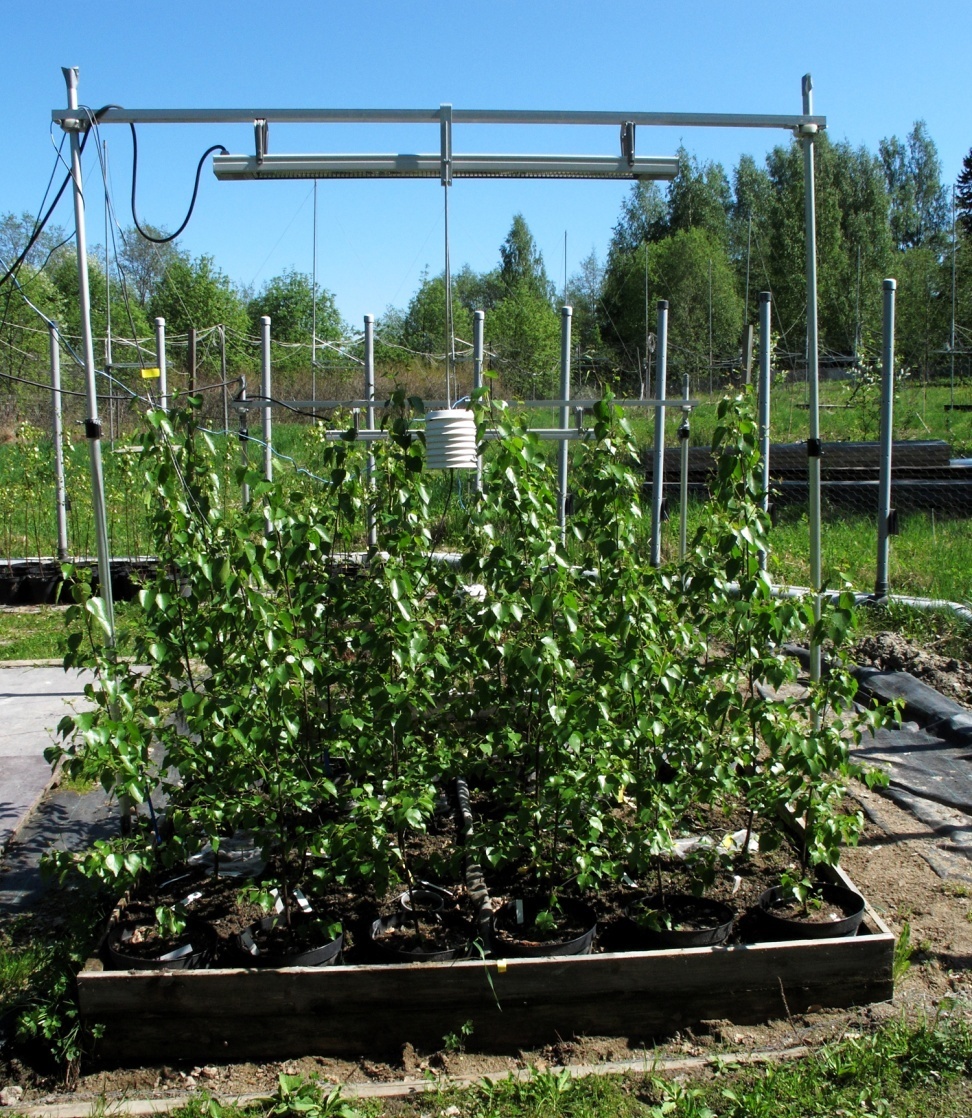
In my research with silver birch (Betula pendula), I quickly realized that a successful Environmental Monitoring Program (EMP) is more than just taking measurements. It requires a clear plan, regular reviews, and proper data analysis.
Without a structured EMP, even careful measurements can become outdated. Local conditions change. New regulations may appear. Ecosystems may respond differently over time. A good EMP ensures that monitoring leads to action and supports long-term decision-making.
In this article, I explain:
What an EMP is..
How to trend environmental data..
How to review a program..
Practical tips from my field experience using Excel and SPSS..
What Is an Environmental Monitoring Program (EMP)?
An EMP is a documented plan for collecting and analyzing environmental data.
It defines:
Scope – Which environmental parameters will be measured.
Common parameters include:
Temperature
Humidity
CO₂ and O₃ levels
Soil moisture
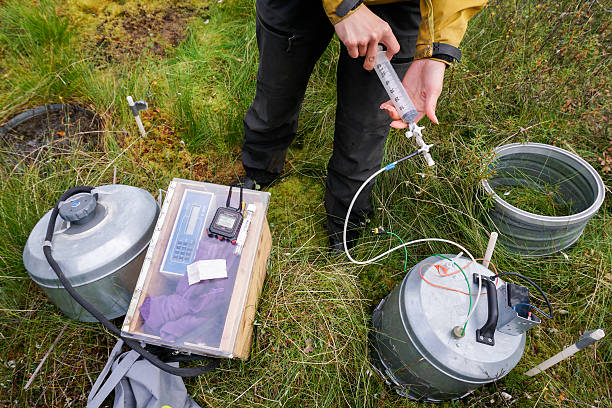
Soil respiration
Leaf area and stem growth
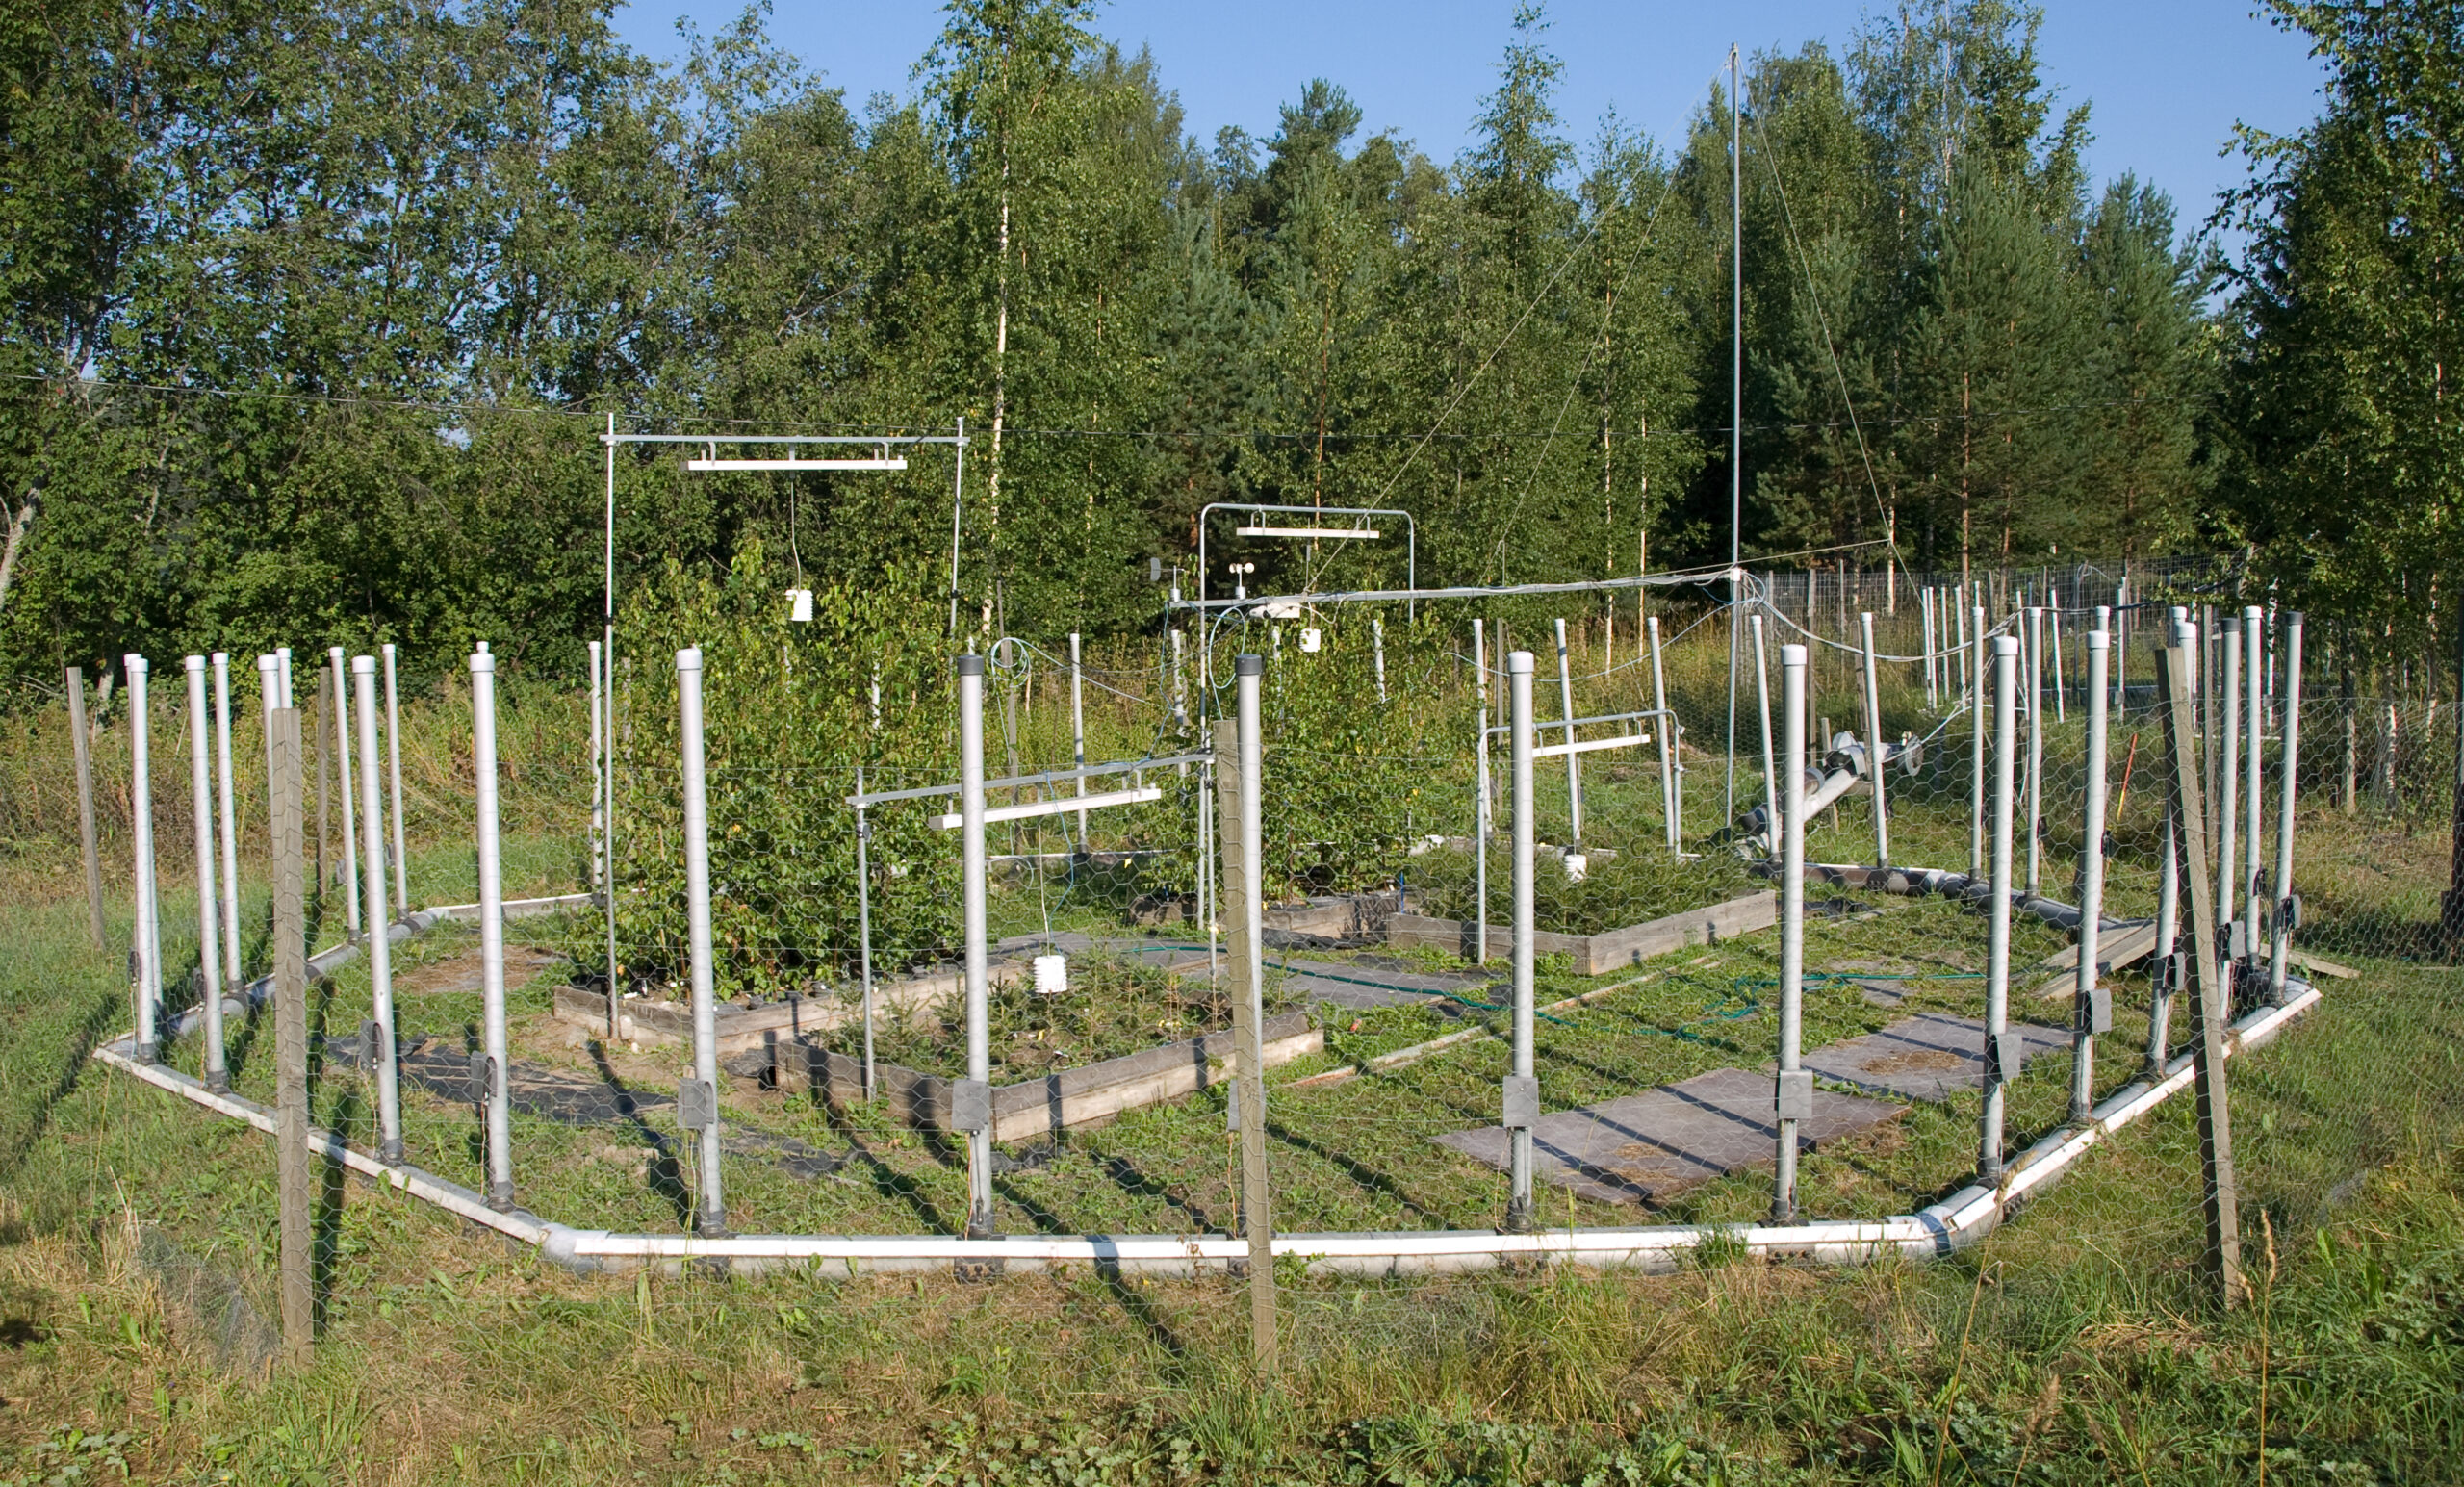
Sampling locations. Where sensors or manual measurements are taken.
Sampling frequency. How often data is collected. This can be hourly, daily, weekly, or seasonal.
Action levels. Thresholds for intervention. For example, if soil CO₂ efflux exceeds a set limit, additional monitoring or mitigation may be needed.
Data analysis and reporting. How data is processed, interpreted, and communicated to decision-makers.
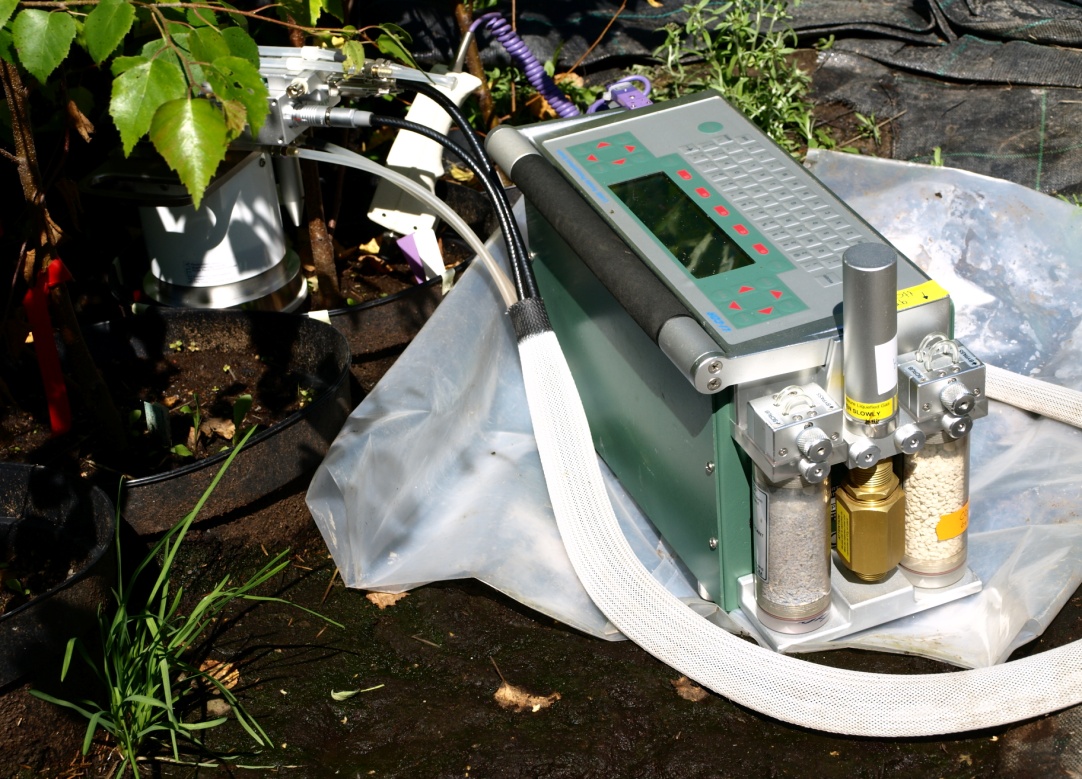
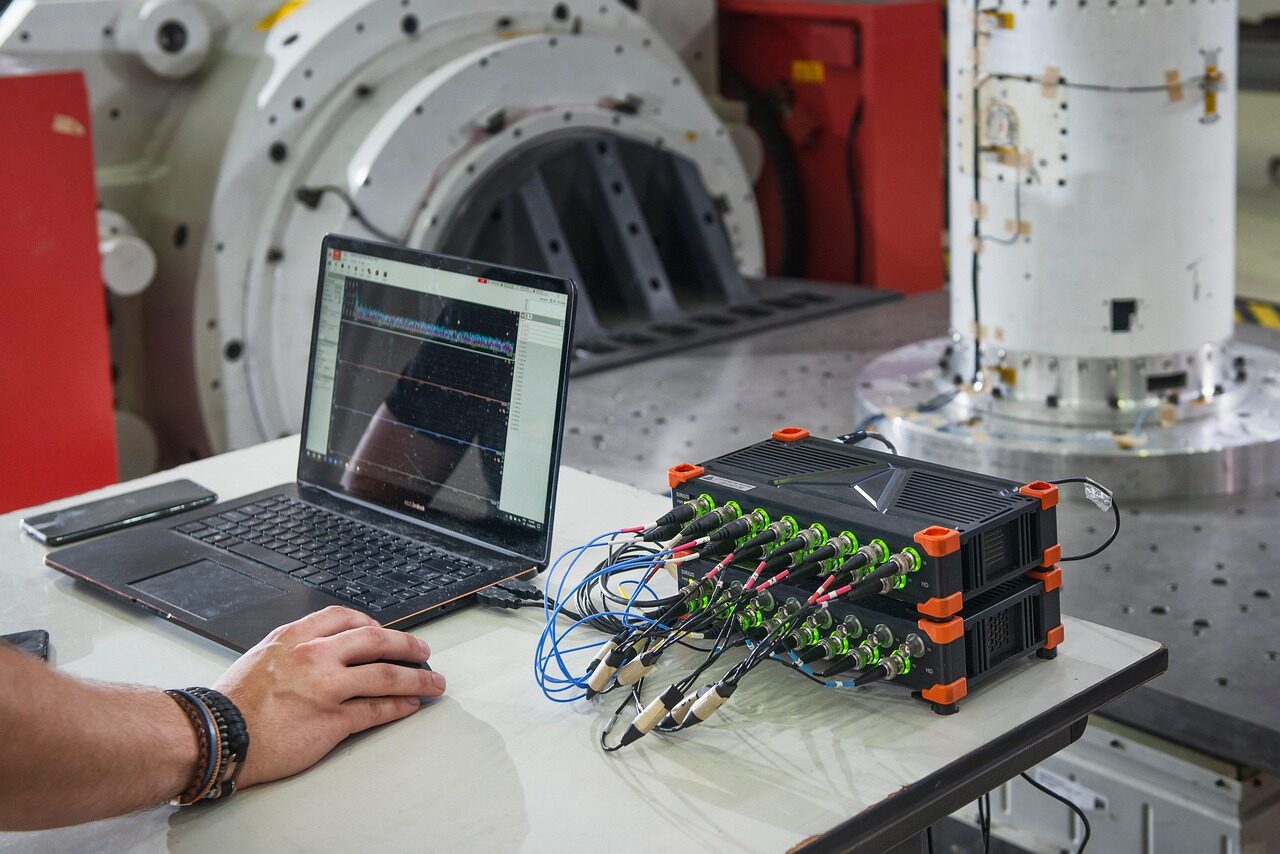
During my fieldwork, I used both manual measurements and automated sensors. I measured stem height, leaf area, soil respiration, and soil moisture. Automated sensors recorded data continuously. I connected them to a computer installed in a field cabin. Wires and connectors ran from the plots to the computer. This setup allowed me to track ozone levels and soil moisture variations in real time.
This combination ensured that the EMP captured short-term fluctuations and long-term trends.
How to Trend Environmental Monitoring Data
Trending data turns raw measurements into meaningful patterns. It allows managers to detect changes, evaluate stressors, and make informed decisions.
Here is how I trended my data:
1. Organizing Raw Data
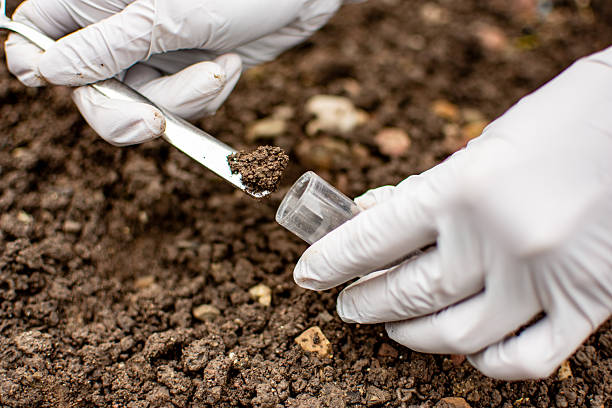
I recorded every measurement manually during field visits.
This included:
Stem height and diameter
Leaf count and leaf area
Soil CO₂ flux
Soil moisture and temperature
I used Excel to organize the data. I created tables for each plot and each measurement date. I calculated mean values and grouped data by genotype and treatment. Excel helped me clean errors and prepare the data for statistical analysis.
2. Statistical Analysis
With hundreds of data points, I used SPSS to run statistics.
SPSS allowed me to:
Perform ANOVA to see differences between treatments
Use linear mixed models for repeated measures
Compare genotype responses to warming and ozone
SPSS helped identify which trends were statistically significant. For example, soil respiration increased under warming in one genotype but not the other.
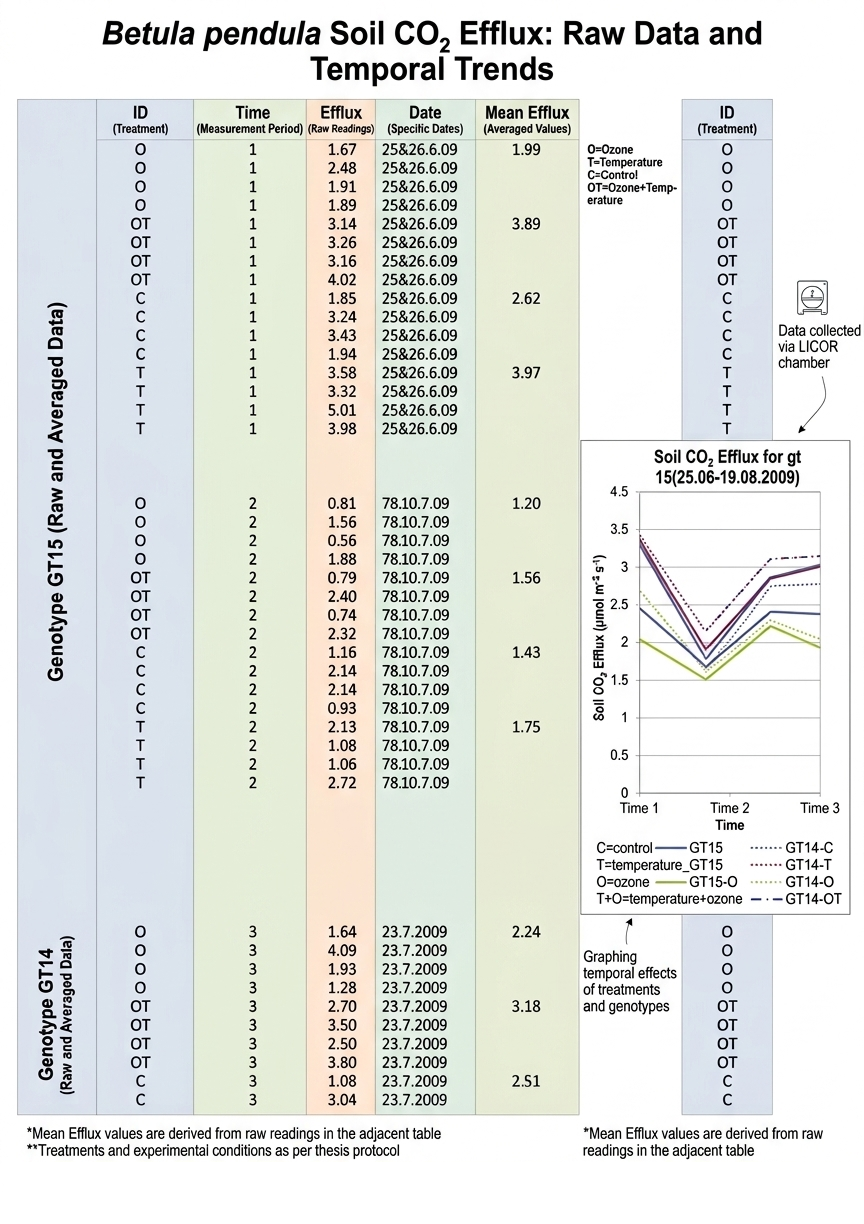
3. Plotting and Visualization
I created graphs in Excel to visualize trends.
I plotted:
Soil CO₂ efflux over time
Stem growth across the season
Leaf area changes
Visualizing data made patterns easier to see. Seasonal cycles and spikes were clear. I could also compare how two genotypes responded differently.
4. Interpreting Trends
Trends help answer questions like:
Is warming increasing soil respiration?
Are ozone levels affecting stem growth?
Do different genotypes respond differently to environmental stressors?
By combining Excel and SPSS, I could turn raw numbers into insights. This helped plan future sampling and adjust the EMP.
The Review Cycle
A good EMP is dynamic. It should be reviewed regularly. I learned this in the field. Even small changes in conditions can make a program outdated.
When to Review an EMP
Annually. At minimum, review the EMP every year.
After regulatory changes. If laws or guidelines change, update the program.
When ecosystem changes occur. If a new stressor appears or a species shows unusual growth.
During my research, I reviewed the program after each growing season. I updated sampling frequency, corrected measurement errors, and adjusted action levels. This ensured that data stayed relevant.
How to Review
Compare trends from the past year with previous years.
Identify anomalies or unexpected results.
Check that sensors are calibrated and data logging is correct.
Update the protocol if new questions arise or new tools are available.
Why Trending Matters
Trending data is critical for:
Evidence-based management. Managers need patterns, not single measurements.
Policy decisions.Authorities can see when interventions are required.
Long-term sustainability. Understanding trends helps predict future ecosystem changes.
In my silver birch study, trending revealed genotype-specific responses. One genotype increased growth under warming. Another genotype showed minor changes. Without trending, these differences would be invisible.
Practical Tips from My Fieldwork
1. Follow a standard protocol,
2. Document everything. Record environmental conditions, sensor calibrations, and anomalies.
3. Combine manual and automated data. Sensors capture continuous data; manual checks validate results.
4. Use Excel for organization. Calculate averages, correct errors, and prepare for analysis.
5. Use SPSS for statistics. Test significance and model trends over time.
6. Visualize trends. Graphs make changes easier to understand.
7. Review regularly. Update the program yearly or when conditions change.
Conclusion
An Environmental Monitoring Program is more than just collecting data. It is a planned, structured process to understand environmental change.
Data without trending is incomplete. By organizing, analyzing, and visualizing data, raw measurements become actionable knowledge. A review cycle ensures the program stays effective.
In my work, I used Excel and SPSS to handle large datasets. I tracked stem growth, leaf area, and soil CO₂ flux. I combined manual fieldwork with automated sensors connected to a computer cabin. Trending revealed patterns that informed management decisions and helped assess ecosystem health.
A well-designed EMP supports sustainable environmental management. It provides evidence for land managers, regulators, and policymakers. Effective trending turns data into insights that guide decisions, protect ecosystems, and ensure long-term sustainability.
FAQs
What is an environmental monitoring program?
documented plan that specifies what to measure, where, how often, and how to interpret results.
How do you trend environmental monitoring data?
Organize raw data, calculate averages, run statistical analyses, plot graphs, and compare trends over time.
When should the environmental monitoring program be reviewed?
At least annually, or when regulations, industrial activity, or ecosystem conditions change.
What is the importance of environmental monitoring in management?
It provides evidence that ecosystems remain within safe limits and that interventions are working.
What environmental parameters need to be monitored?
Depends on the site. Commonly monitored: temperature, humidity, CO₂, O₃, soil moisture, pollutants, plant growth, and soil respiration.